Other End of the Wire

Free charts · CC BY 4.0

Free charts about the U.S. power grid

Neutral charts built from U.S. government data: the Energy Information Administration, national laboratories and grid operators. Free to use, including commercially, in articles, classes, presentations and on Wikipedia. Just credit “Other End of the Wire”.

Free to use under CC BY 4.0. You may copy, share, translate and adapt these charts for any purpose. Please credit “Other End of the Wire” with a link to otherendofthewire.com, name the license, and say if you changed the chart.

Every chart shows public agency data and nothing else: no opinions, no company or product promotion, no photos or third-party images. Each one carries its data source in the image, and the CSV behind it is one click away.

How to cite

Online: Chart: Other End of the Wire, CC BY 4.0. Data: U.S. EIA (or the source named on the chart).

Print, TV, slides: Chart: Other End of the Wire (otherendofthewire.com), CC BY 4.0. Data: U.S. Energy Information Administration.

Changed the chart? Add “adapted” (e.g. “Chart adapted from Other End of the Wire, CC BY 4.0”). Please don’t suggest that we endorse your article or position.

Found an error in a chart? Tell us; corrections are logged on the corrections page and the chart is updated.

The charts
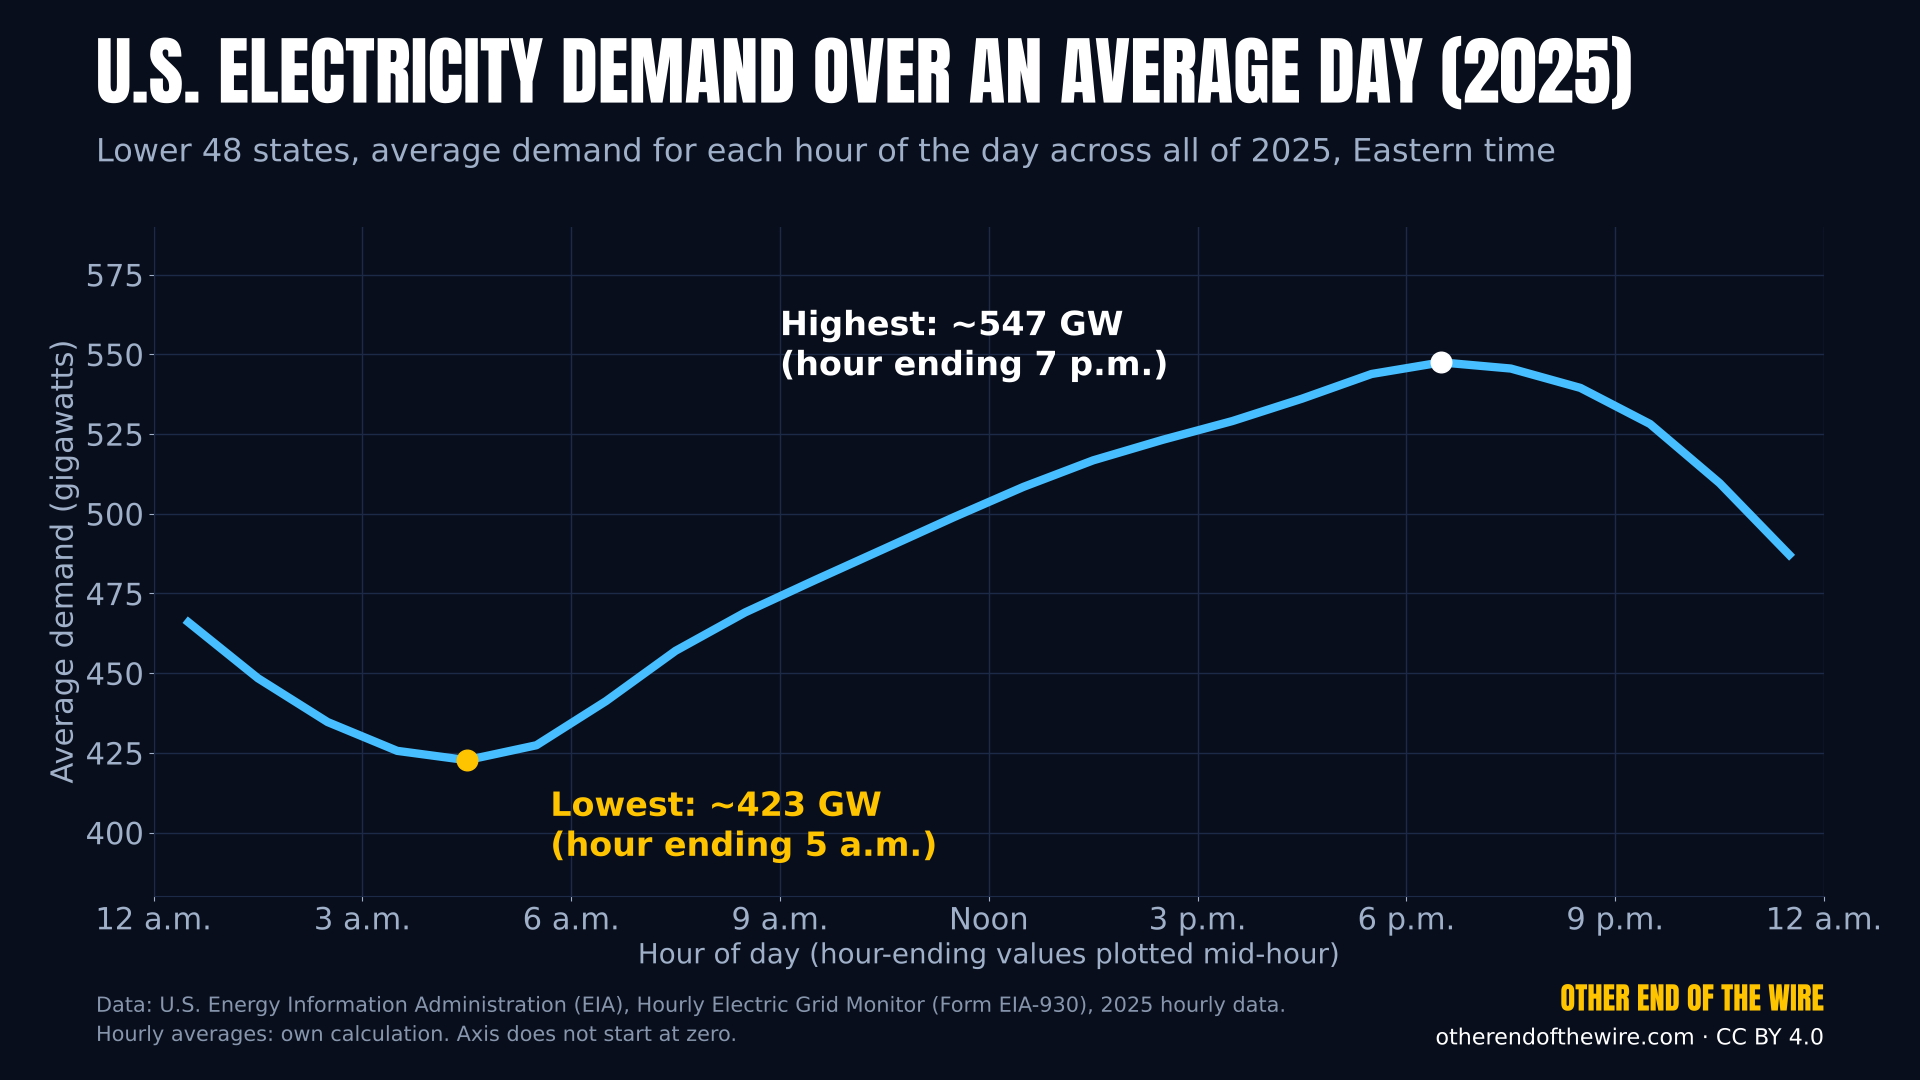
Line chart of average U.S. electricity demand by hour in 2025: lowest about 423 gigawatts in the hour ending 5 a.m., highest about 547 gigawatts in the hour ending 7 p.m.
U.S. electricity demand over an average day (2025)Average electricity demand of the Lower 48 states for each hour of the day, averaged over all days of 2025 (Eastern time). Demand is lowest around 4-5 a.m. (about 423 GW) and highest around 6-7 p.m. (about 547 GW).
Data: U.S. Energy Information Administration (EIA), Hourly Electric Grid Monitor (Form EIA-930), respondent US48, demand, hourly 2025; via EIA API v2 electricity/rto/region-data [1]
Data as of: Data year 2025 (EIA-930 is operator-reported and may be revised); retrieved Nov 7, 2026
From the video: Where Your Power Comes From at 3 A.M. vs. 3 P.M.
PNG (1920×1080)CSV dataCC BY 4.0
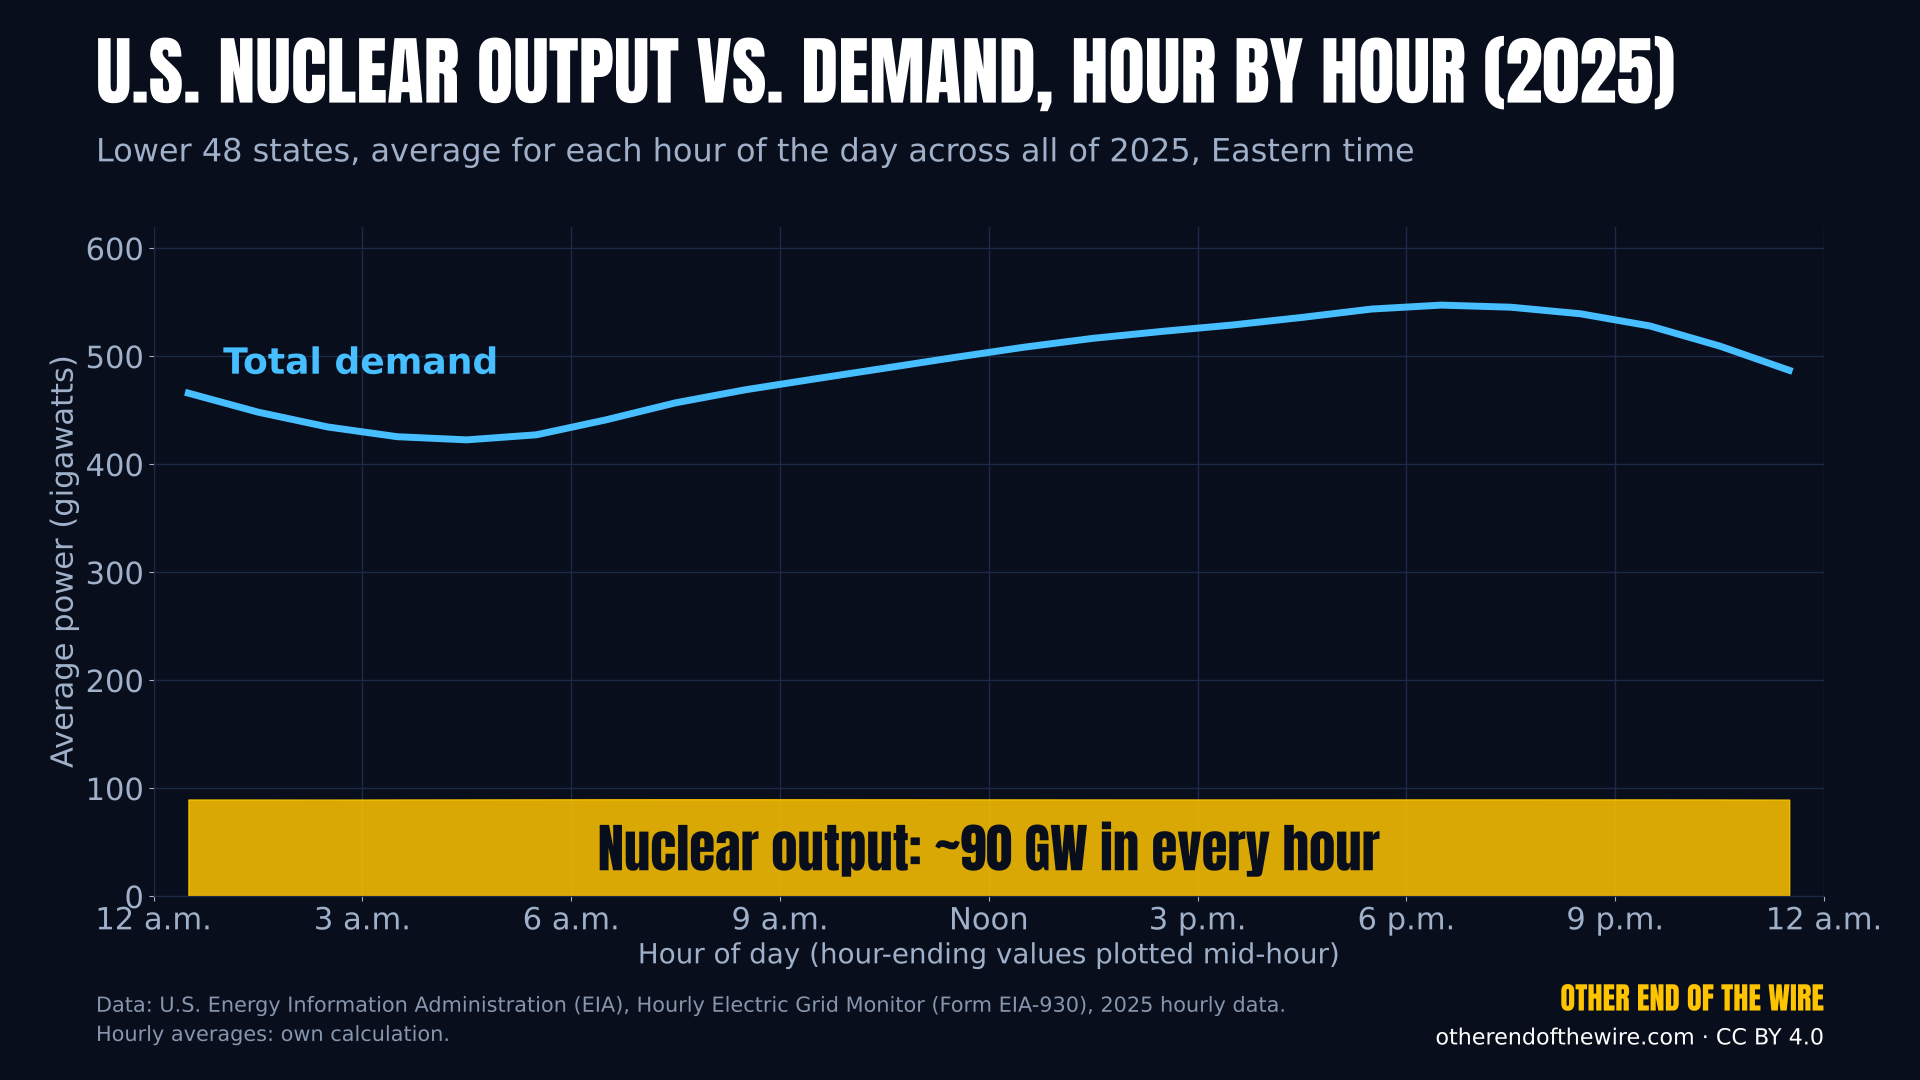
Chart of average U.S. demand by hour as a curve and nuclear output as a flat band at about 90 gigawatts in every hour of 2025.
U.S. nuclear output vs. demand, hour by hour (2025)Average total electricity demand and average nuclear generation of the Lower 48 states for each hour of the day in 2025 (Eastern time). Nuclear output stays at about 90 GW in every hour while demand rises and falls.
Data: EIA, Hourly Electric Grid Monitor (Form EIA-930), respondent US48, demand and net generation from nuclear, hourly 2025; via EIA API v2 electricity/rto/region-data and fuel-type-data [1]
Data as of: Data year 2025; retrieved Nov 7, 2026
From the video: Where Your Power Comes From at 3 A.M. vs. 3 P.M.
PNG (1920×1080)CSV dataCC BY 4.0
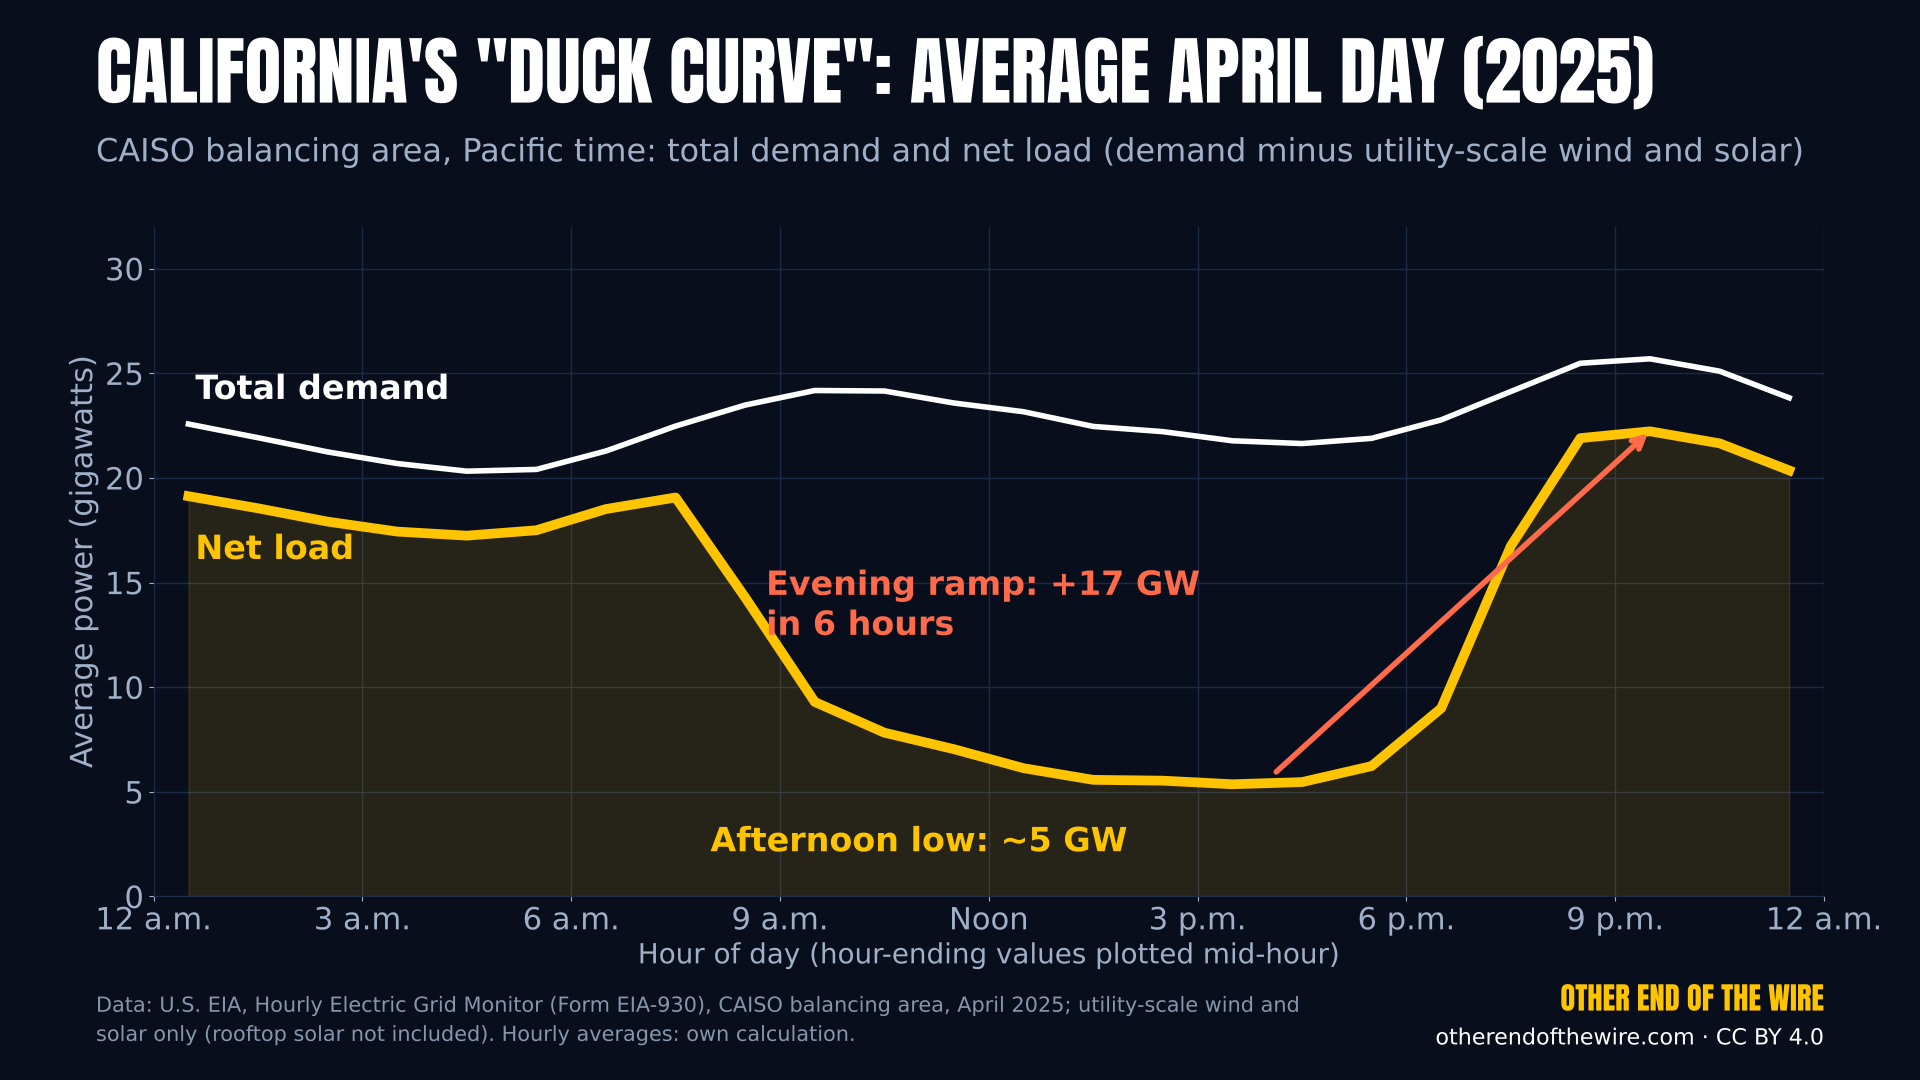
Duck curve: California net load falls to about 5 gigawatts in mid-afternoon and rises about 17 gigawatts in six hours toward the evening, with total demand above it.
California's duck curve: average April day (2025)Total demand and net load (demand minus utility-scale wind and solar) in the California ISO balancing area on an average April day of 2025 (Pacific time). Net load falls to about 5 GW in mid-afternoon and rises by about 17 GW over the following six hours. Rooftop solar is not included in the EIA data.
Data: EIA, Hourly Electric Grid Monitor (Form EIA-930), balancing area CISO, demand and net generation from solar and wind, hourly, April 2025; definition of net load and duck curve: EIA, Today in Energy, id=56880 [1] [2]
Data as of: April 2025; retrieved Nov 7, 2026
From the video: Where Your Power Comes From at 3 A.M. vs. 3 P.M.
PNG (1920×1080)CSV dataCC BY 4.0
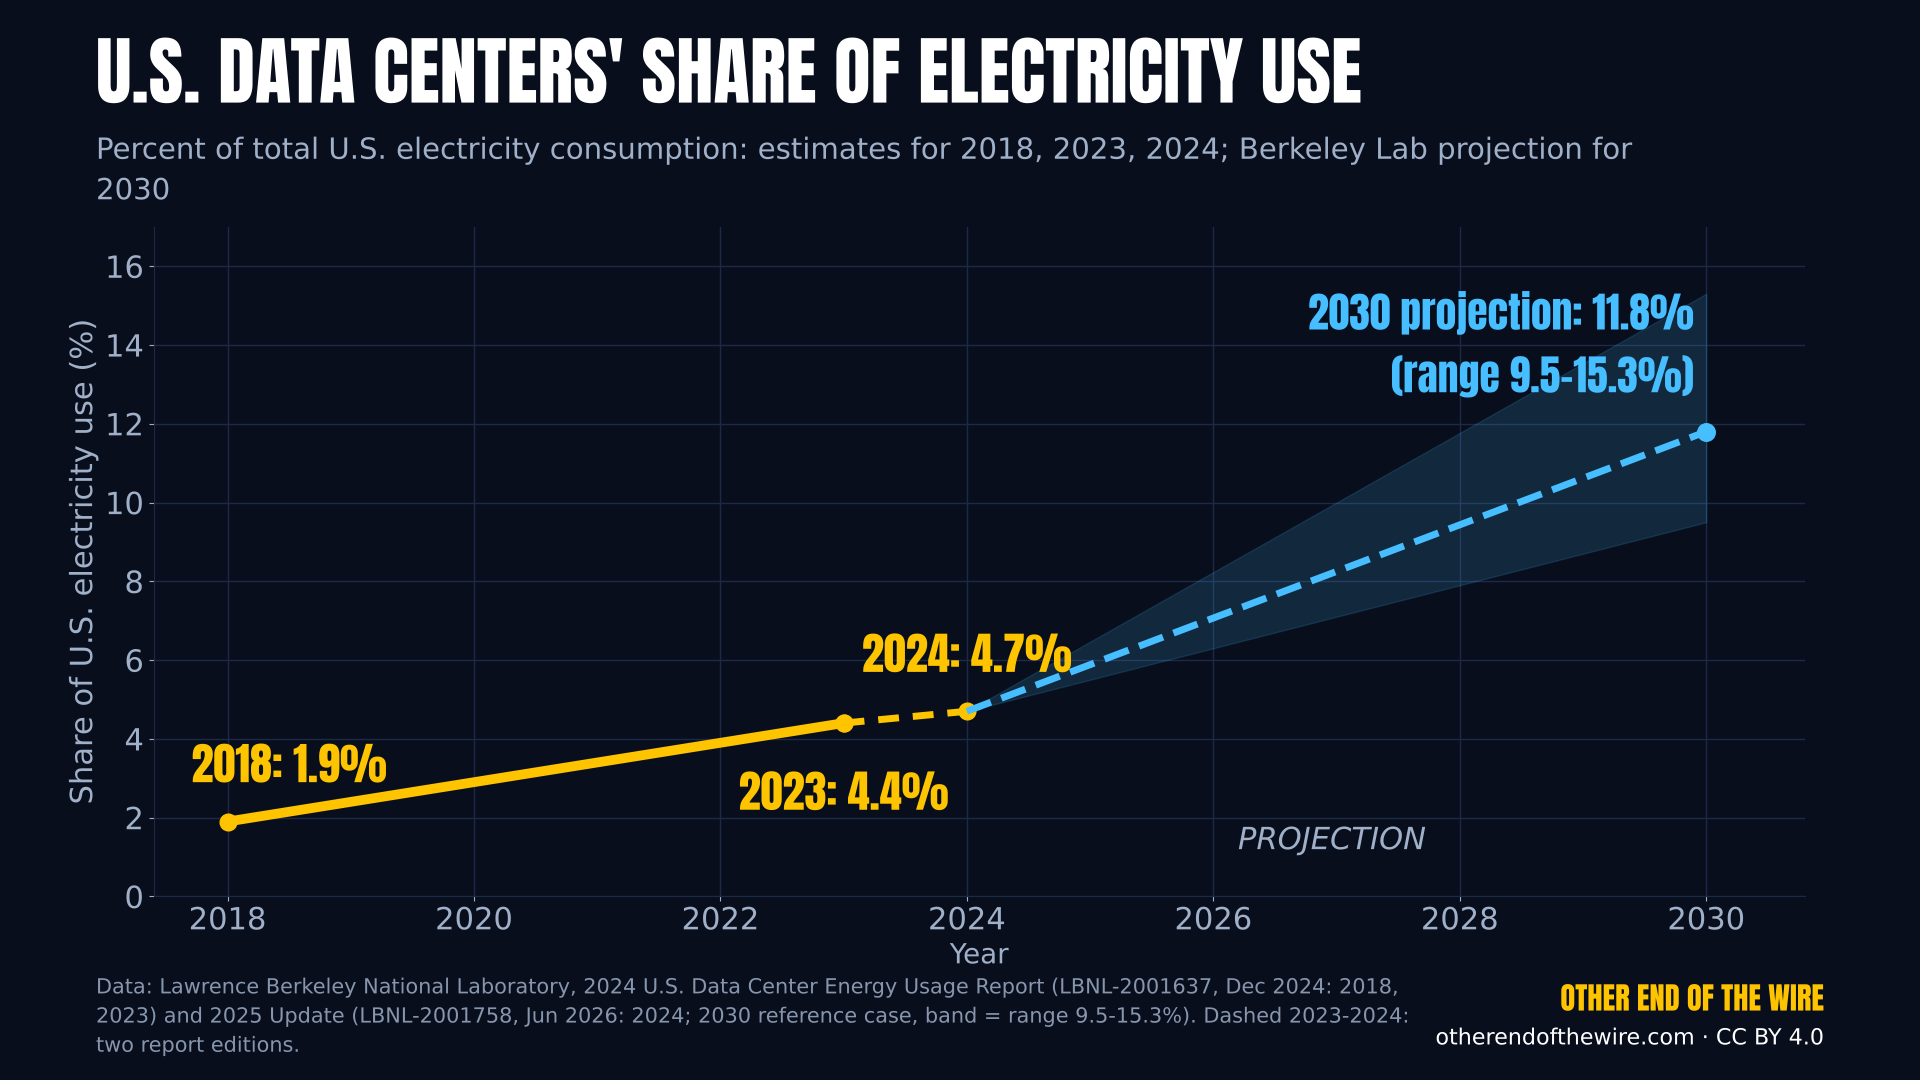
Line chart of data centers' share of U.S. electricity: 1.9 percent in 2018, 4.4 percent in 2023, 4.7 percent in 2024, projected 11.8 percent in 2030 with a range band.
U.S. data centers' share of electricity use (2018-2030)Share of total U.S. electricity consumption used by data centers: 1.9% (2018), 4.4% (2023) and 4.7% (2024), and Berkeley Lab's 2030 reference-case projection of 11.8% (scenario range 9.5-15.3%). 2018 and 2023 from the 2024 report; the 2025 Update revised earlier years slightly downward, so the 2023-2024 step mixes two report editions.
Data: Lawrence Berkeley National Laboratory: Shehabi et al., 2024 United States Data Center Energy Usage Report, LBNL-2001637 (Dec 2024), Executive Summary (2018, 2023); United States Data Center Energy Usage Report: 2025 Update, LBNL-2001758 (Jun 2026), p. 7 / Table 2 (2024, 2030) [1] [2]
Data as of: Reports of Dec 2024 and Jun 2026; 2030 is a projection
From the video: Are Data Centers Really Raising Your Power Bill?
PNG (1920×1080)CSV dataCC BY 4.0
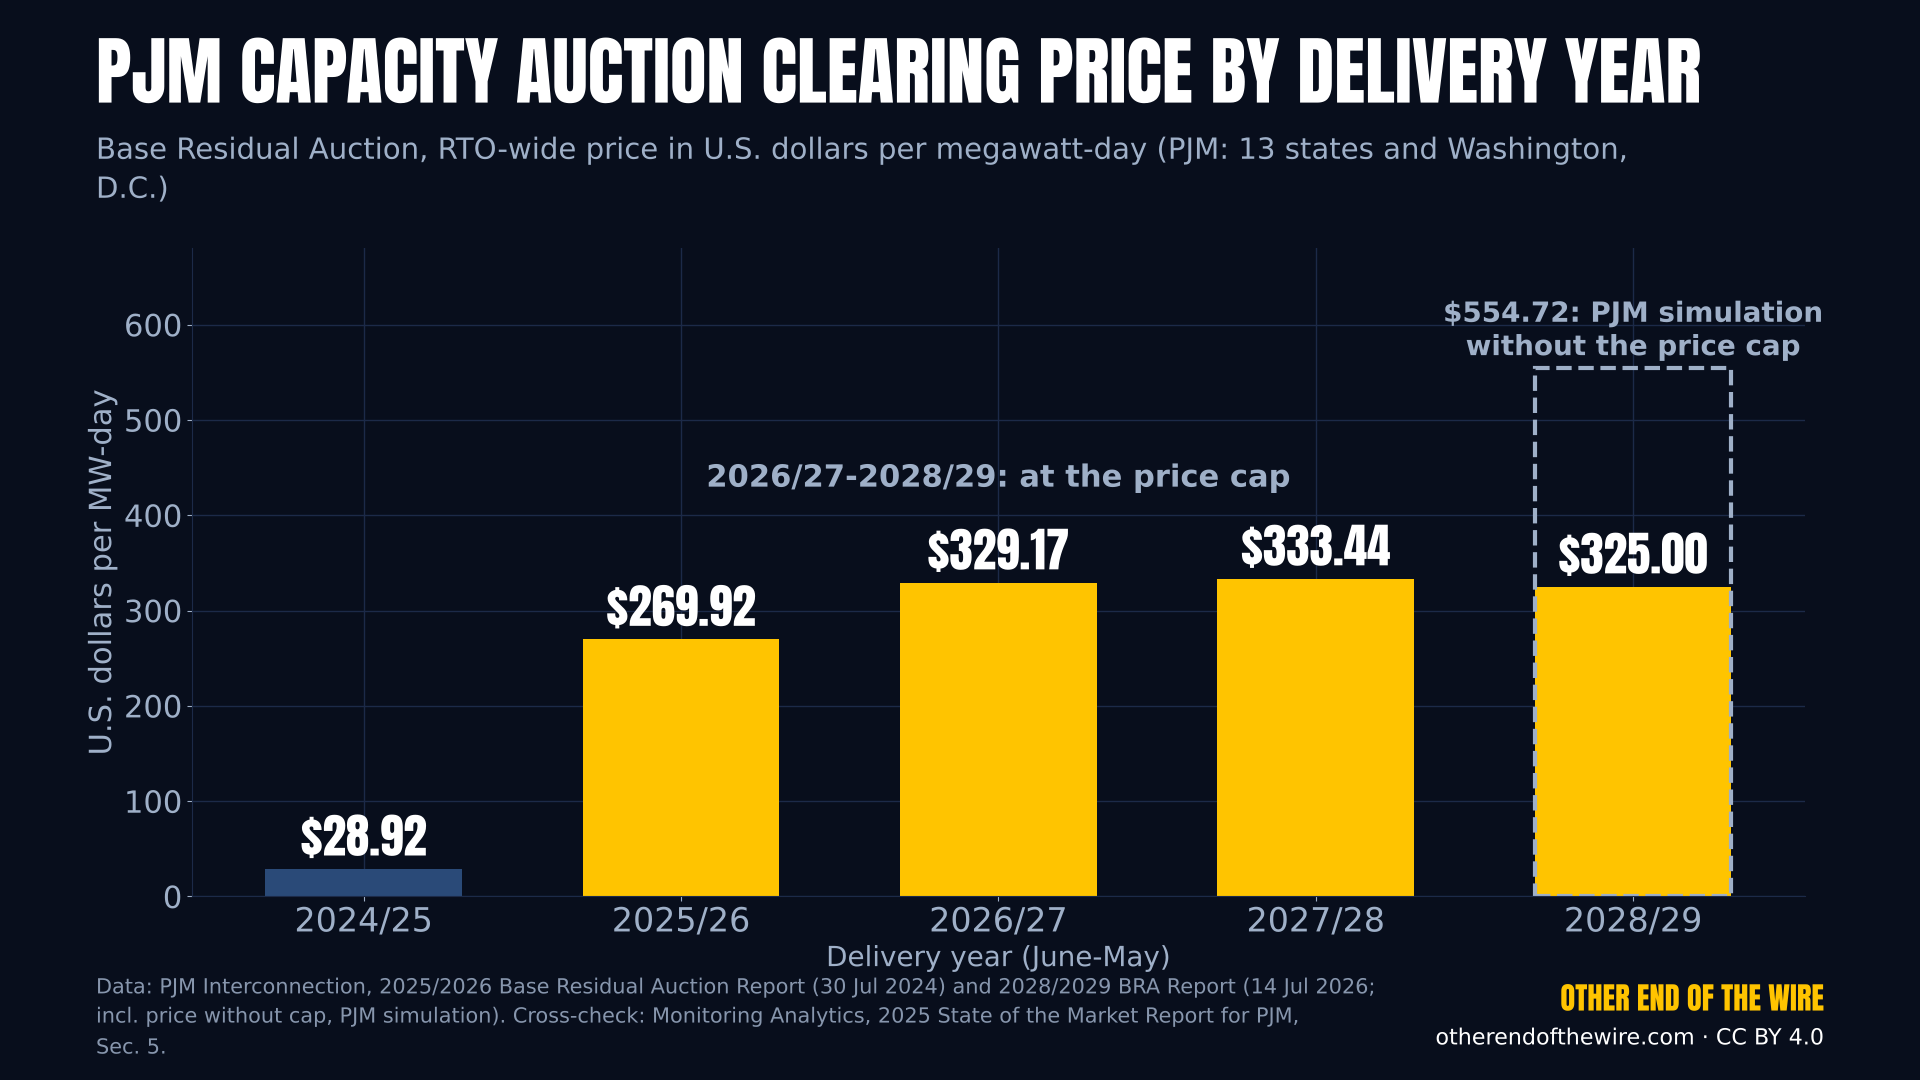
Bar chart of PJM capacity prices: 28.92 dollars per megawatt-day for 2024/25, 269.92 for 2025/26, then about 325 to 333 dollars at the price cap through 2028/29.
PJM capacity auction clearing price by delivery year (2024/25-2028/29)RTO-wide clearing price of PJM's Base Residual Auction in U.S. dollars per megawatt-day: $28.92 (2024/25), $269.92 (2025/26), $329.17 (2026/27), $333.44 (2027/28) and $325.00 (2028/29; the last three at the price cap). Dashed: PJM's simulated price without the cap for 2028/29, $554.72. 2024/25 was the lowest RTO price since at least 2018/19 (earlier years $34-165).
Data: PJM Interconnection, 2025/2026 Base Residual Auction Report (30 Jul 2024); 2028/2029 Base Residual Auction Report (14 Jul 2026), Table 2 (incl. 2018/19-2023/24) and simulation without price cap; cross-check: Monitoring Analytics, 2025 State of the Market Report for PJM, Section 5 [1] [2]
Data as of: Auctions through Jul 2026
From the video: Are Data Centers Really Raising Your Power Bill?
PNG (1920×1080)CSV dataCC BY 4.0
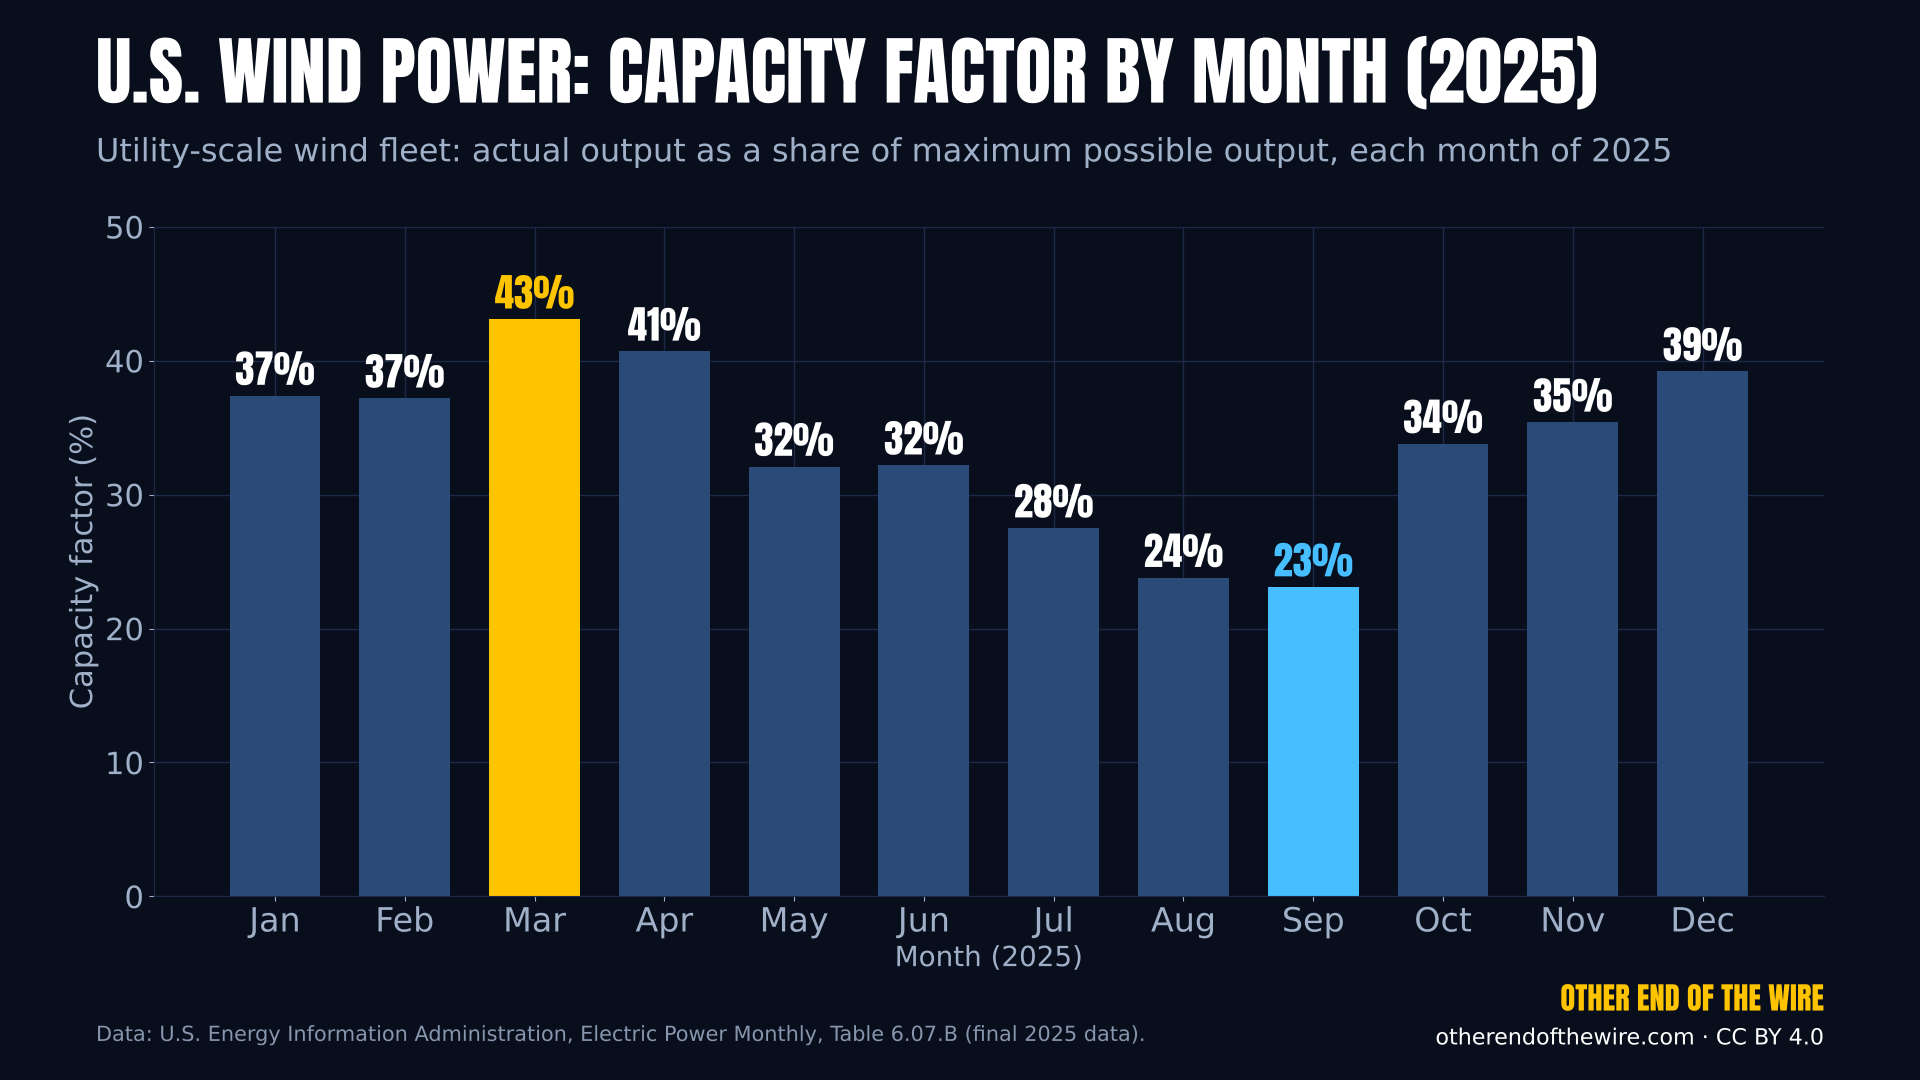
Bar chart of U.S. wind capacity factor by month in 2025, highest in March at 43 percent and lowest in September at 23 percent.
U.S. wind power: capacity factor by month (2025)Monthly capacity factor of the U.S. utility-scale wind fleet in 2025 (actual output as a share of maximum possible output). Highest in March (43%), lowest in September (23%).
Data: EIA, Electric Power Monthly, Table 6.07.B, Capacity Factors for Utility Scale Generators Not Primarily Using Fossil Fuels (final 2025 data) [1]
Data as of: Final 2025 data, EPM release of Oct 2026
From the video: Why Wind Turbines Stop on the Windiest Days
PNG (1920×1080)CSV dataCC BY 4.0
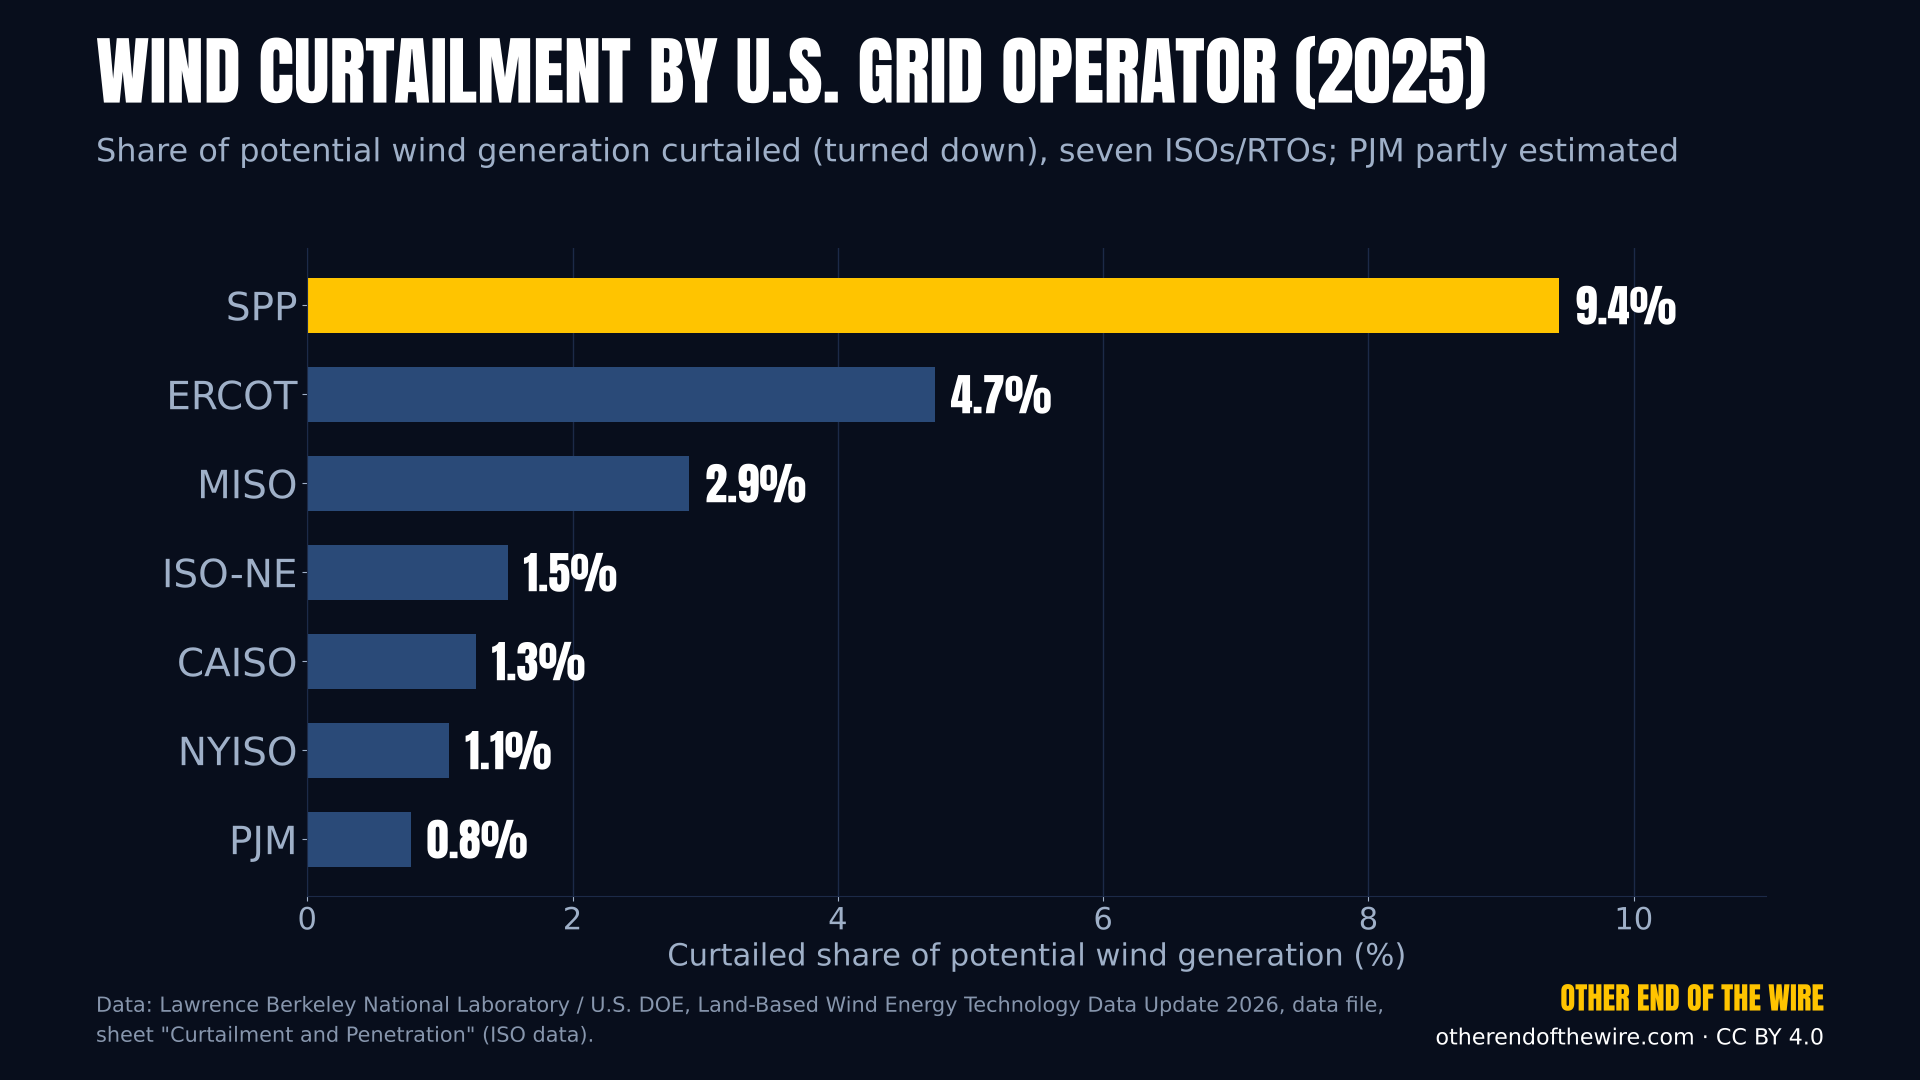
Horizontal bar chart of wind curtailment in 2025: SPP 9.4 percent, ERCOT 4.7, MISO 2.9, ISO-NE 1.5, CAISO 1.3, NYISO 1.1, PJM 0.8.
Wind curtailment by U.S. grid operator (2025)Share of potential wind generation that was curtailed in 2025 in seven U.S. independent system operators / regional transmission organizations: SPP 9.4%, ERCOT 4.7%, MISO 2.9%, ISO-NE 1.5%, CAISO 1.3%, NYISO 1.1%, PJM 0.8% (PJM partly estimated).
Data: Lawrence Berkeley National Laboratory / U.S. DOE, Land-Based Wind Energy Technology Data Update: 2026 Edition (Aug 2026), data file, sheet "Curtailment and Penetration" (ISO data) [1]
Data as of: Data year 2025; LBNL edition of Aug 2026
From the video: Why Wind Turbines Stop on the Windiest Days
PNG (1920×1080)CSV dataCC BY 4.0
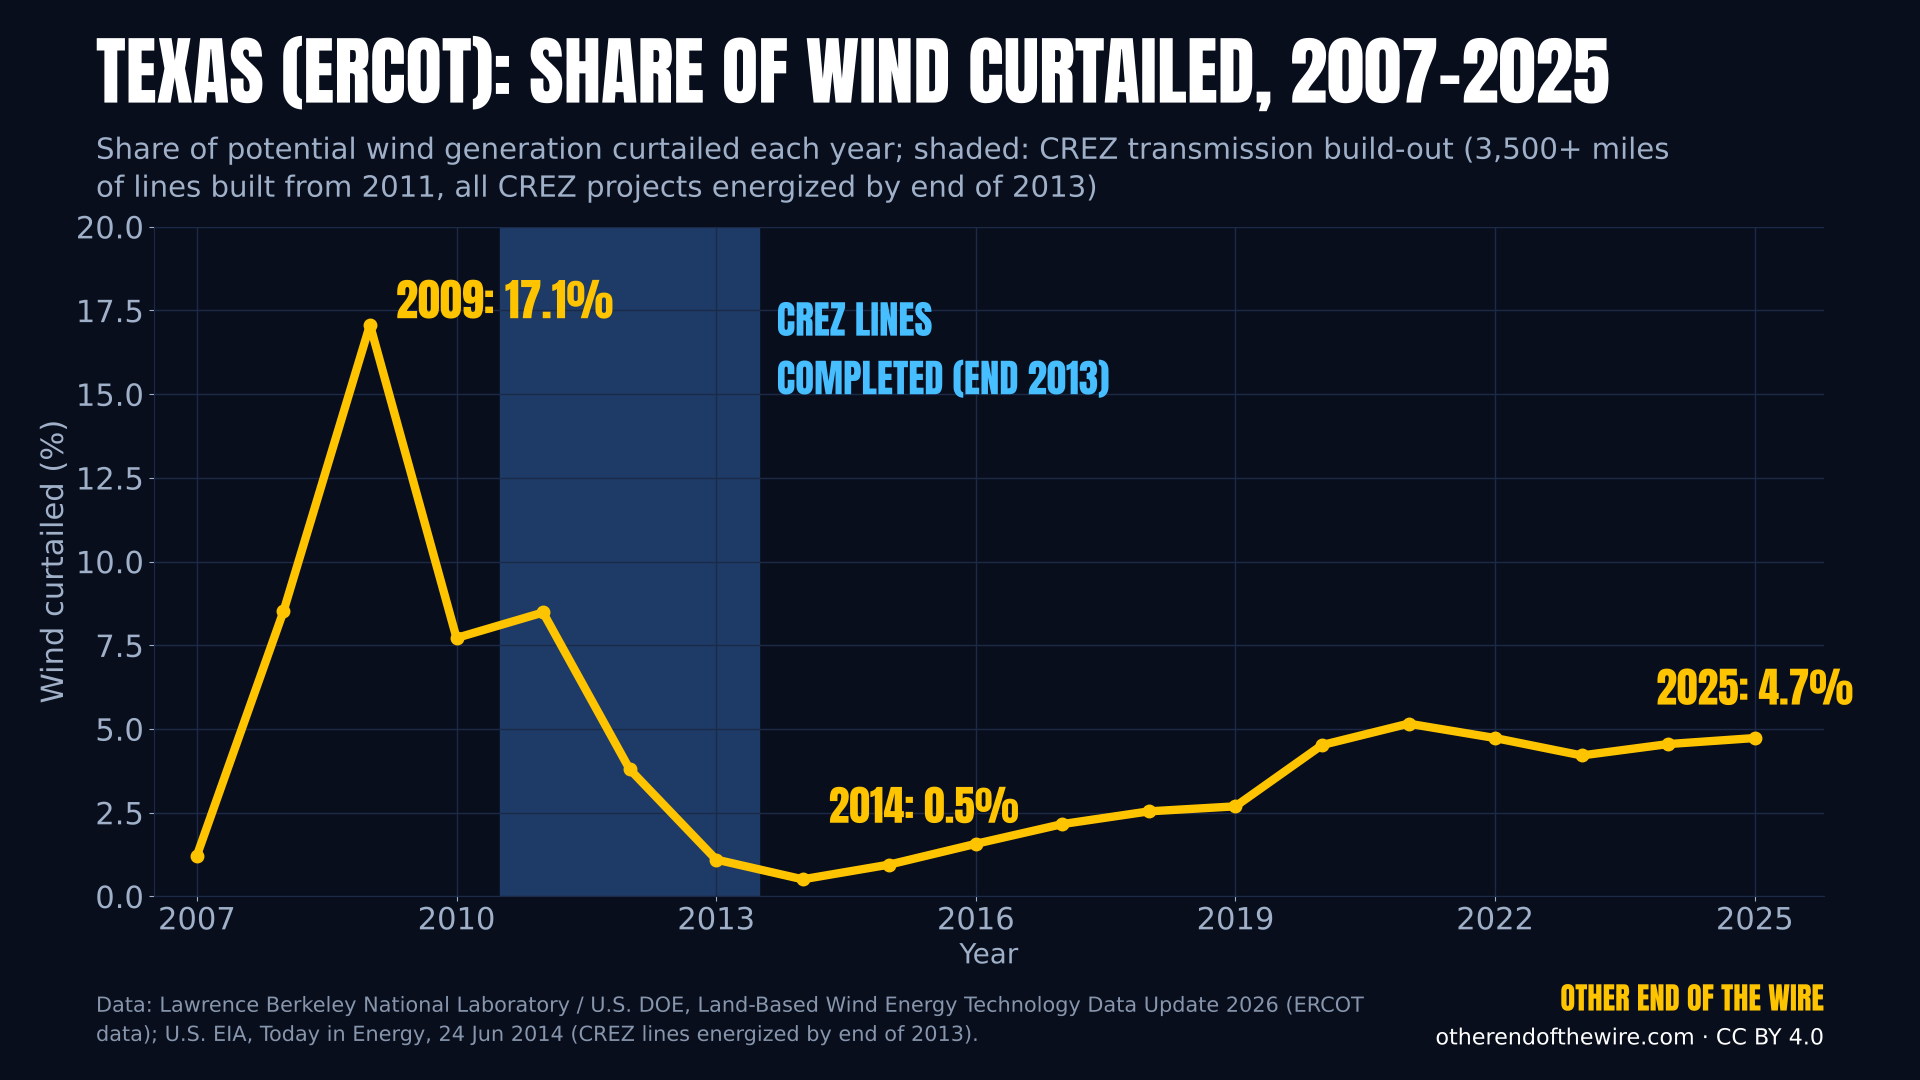
Line chart of ERCOT wind curtailment: peak 17.1 percent in 2009, down to 0.5 percent in 2014 after the CREZ lines, 4.7 percent in 2025.
Texas (ERCOT): share of wind curtailed, 2007-2025Share of potential wind generation curtailed in the ERCOT grid each year from 2007 to 2025: 17.1% in 2009, 0.5% in 2014, after more than 3,500 miles of transmission lines, largely from the Competitive Renewable Energy Zone (CREZ) program, were built from 2011 on; all CREZ projects were energized by the end of 2013. 4.7% in 2025.
Data: Lawrence Berkeley National Laboratory / U.S. DOE, Land-Based Wind Energy Technology Data Update: 2026 Edition (ERCOT curtailment); EIA, Today in Energy, 24 Jun 2014 (CREZ) [1] [2]
Data as of: 2007-2025; LBNL edition of Aug 2026
From the video: Why Wind Turbines Stop on the Windiest Days
PNG (1920×1080)CSV dataCC BY 4.0
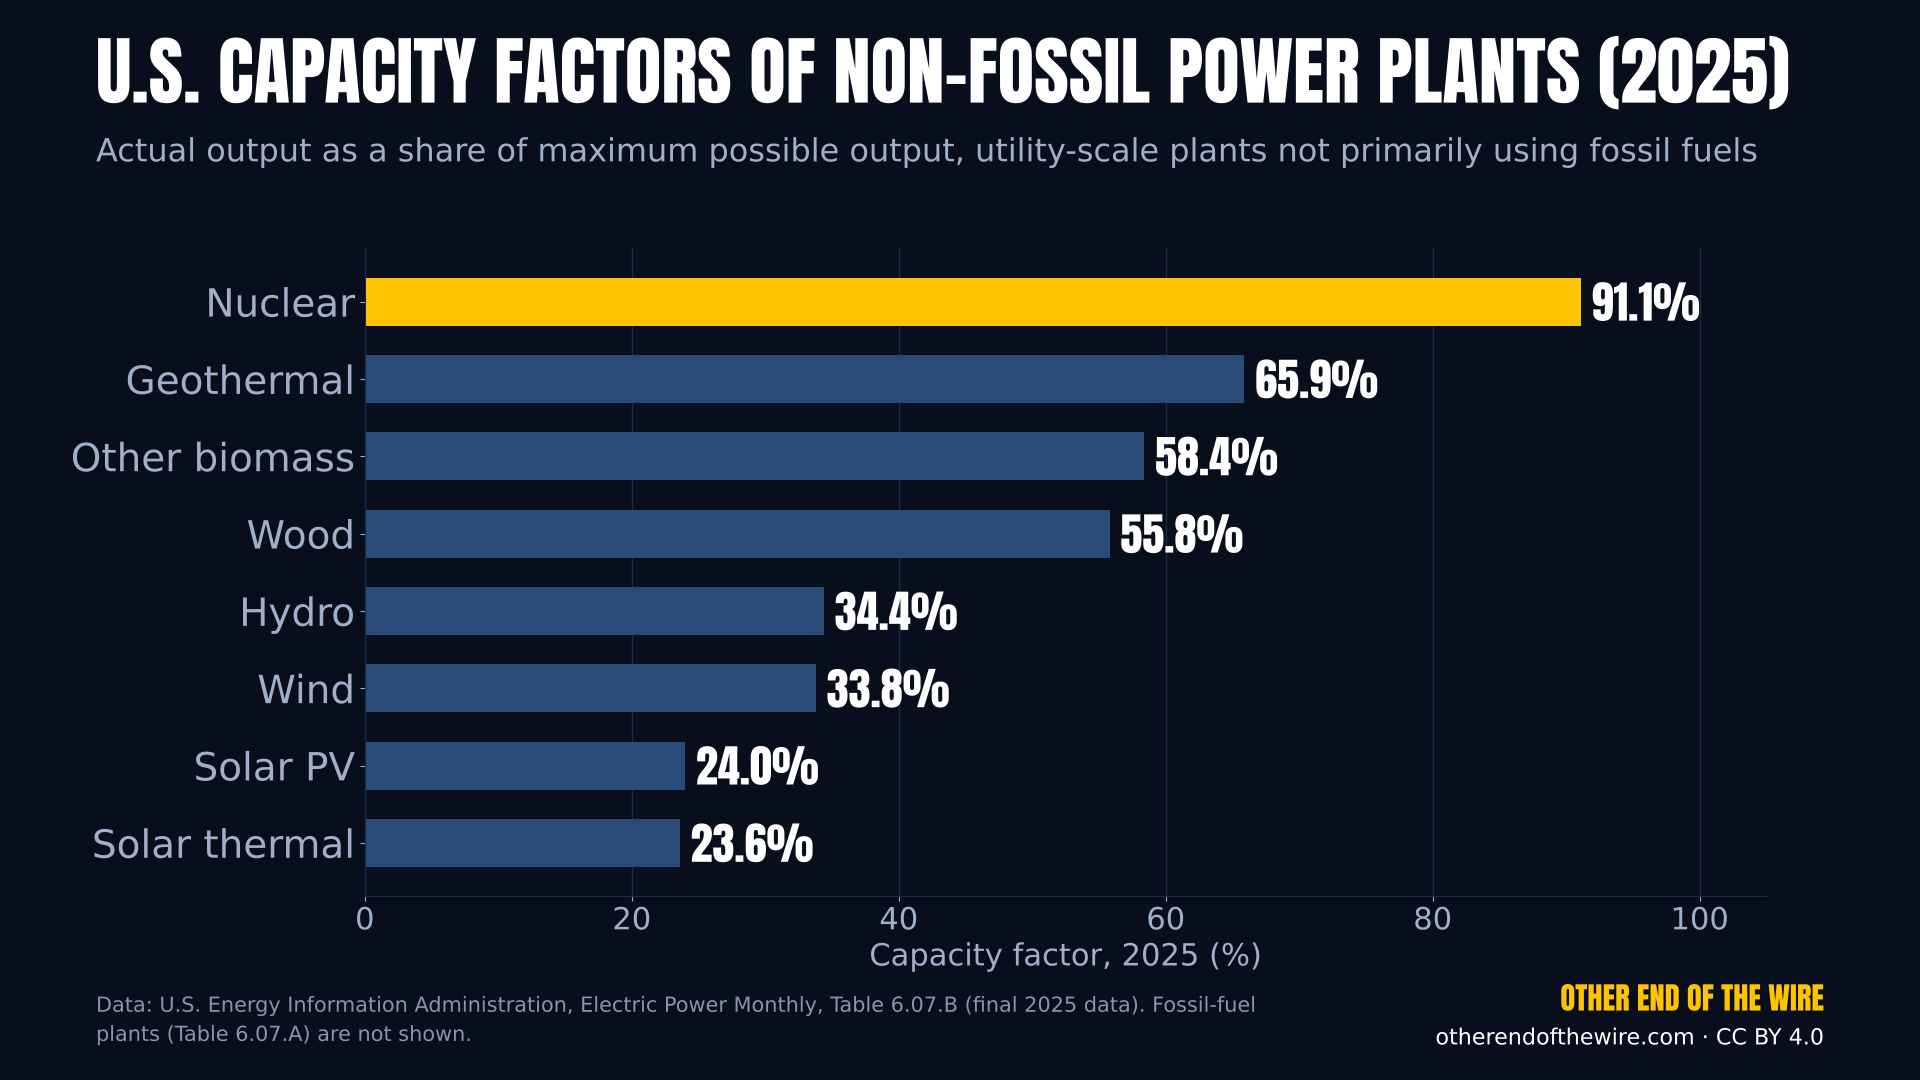
Horizontal bar chart of 2025 capacity factors: nuclear 91.1 percent, geothermal 65.9, other biomass 58.4, wood 55.8, hydro 34.4, wind 33.8, solar PV 24.0, solar thermal 23.6.
U.S. capacity factors of non-fossil power plants (2025)Average 2025 capacity factor of U.S. utility-scale power plants not primarily using fossil fuels: nuclear 91.1%, geothermal 65.9%, other biomass 58.4%, wood 55.8%, hydro 34.4%, wind 33.8%, solar photovoltaic 24.0%, solar thermal 23.6%. Fossil-fuel plants are not shown.
Data: EIA, Electric Power Monthly, Table 6.07.B (final 2025 data, released Oct 23, 2026) [1]
Data as of: Final 2025 data, released Oct 23, 2026
From the video: How Much of a Reactor's Heat Actually Reaches Your Phone?
PNG (1920×1080)CSV dataCC BY 4.0
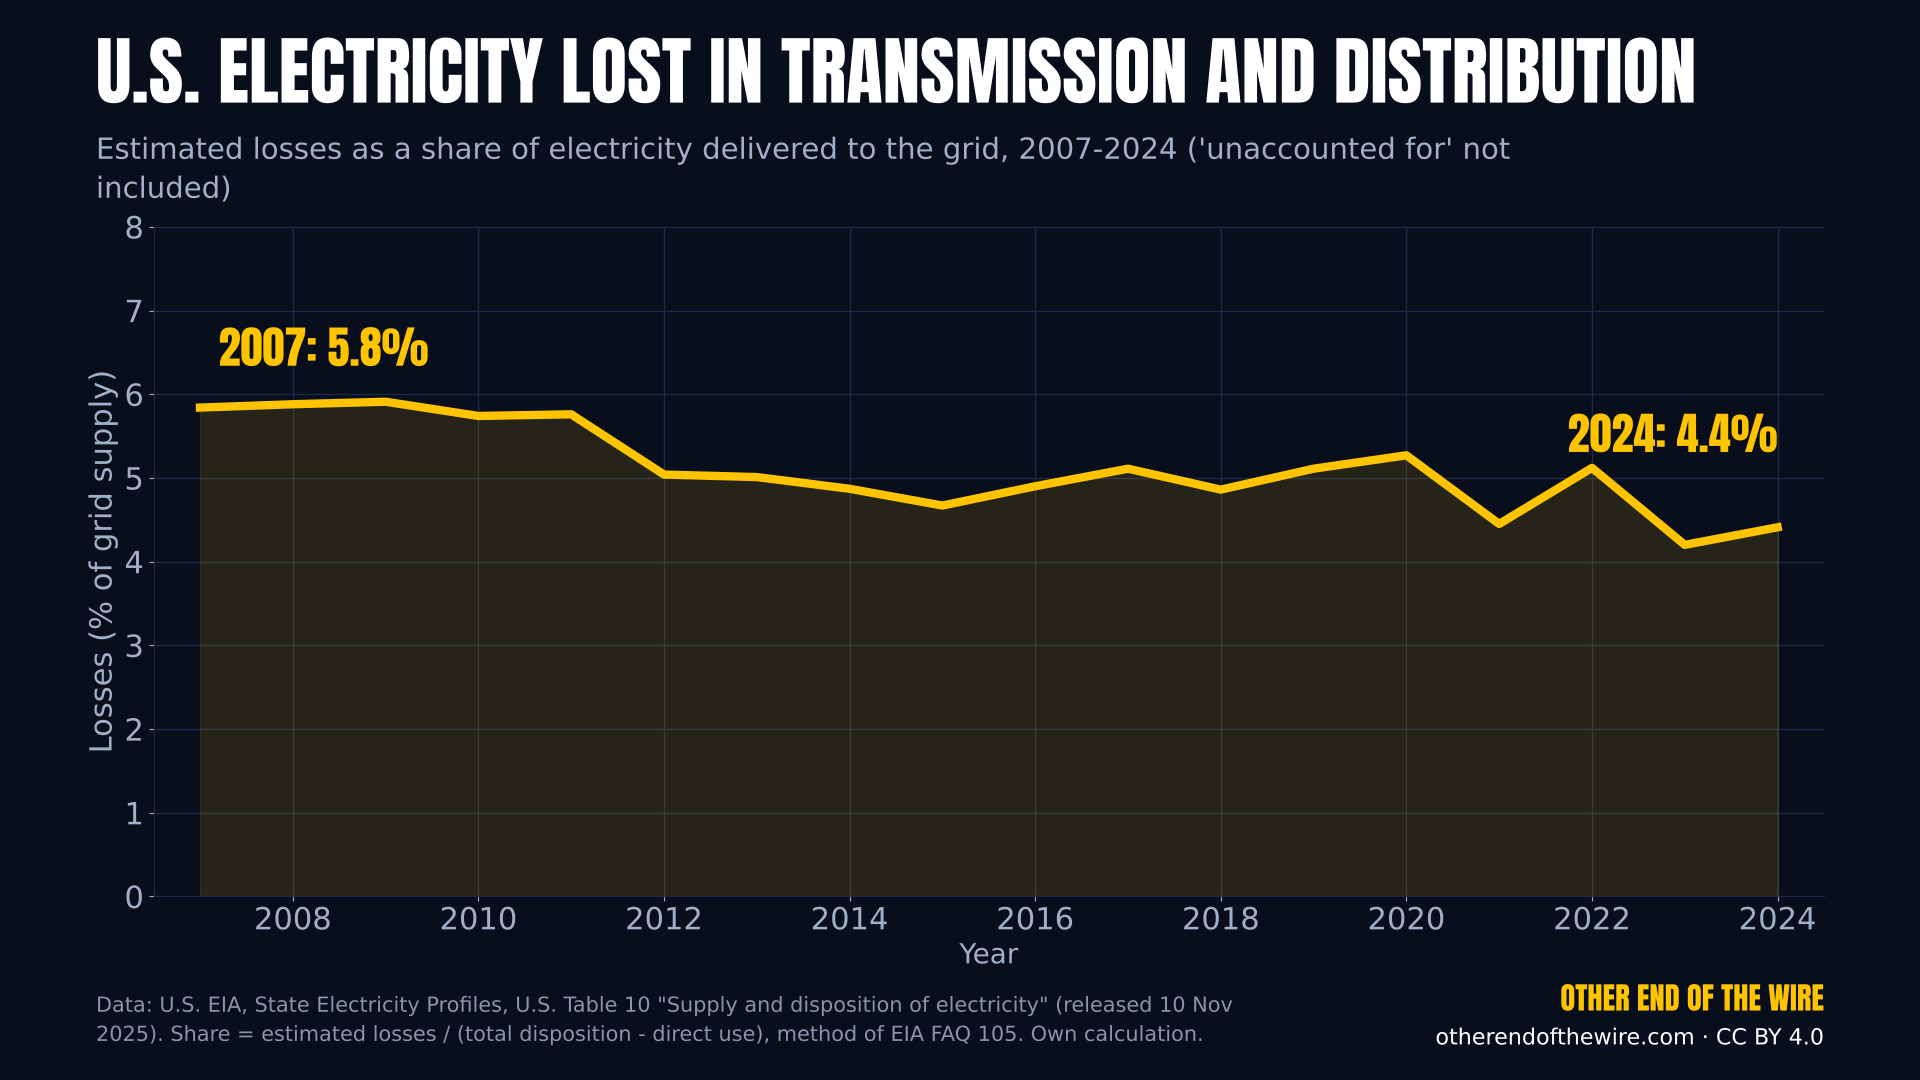
Line chart of U.S. transmission and distribution losses from 5.8 percent in 2007 to 4.4 percent in 2024.
U.S. electricity lost in transmission and distribution, 2007-2024Estimated U.S. transmission and distribution losses as a share of electricity supplied to the grid, 2007-2024: 5.8% in 2007 and 4.4% in 2024 (about 186 billion kWh). Share calculated as estimated losses divided by total disposition minus direct use, following EIA FAQ 105. From 2007 on, EIA lists electricity 'unaccounted for' separately (not included here).
Data: EIA, State Electricity Profiles, United States, Table 10 "Supply and disposition of electricity" (released Nov 10, 2025); method: EIA FAQ 105 [1] [2]
Data as of: 2007-2024, release of Nov 10, 2025
From the video: How Much of a Reactor's Heat Actually Reaches Your Phone?
PNG (1920×1080)CSV dataCC BY 4.0
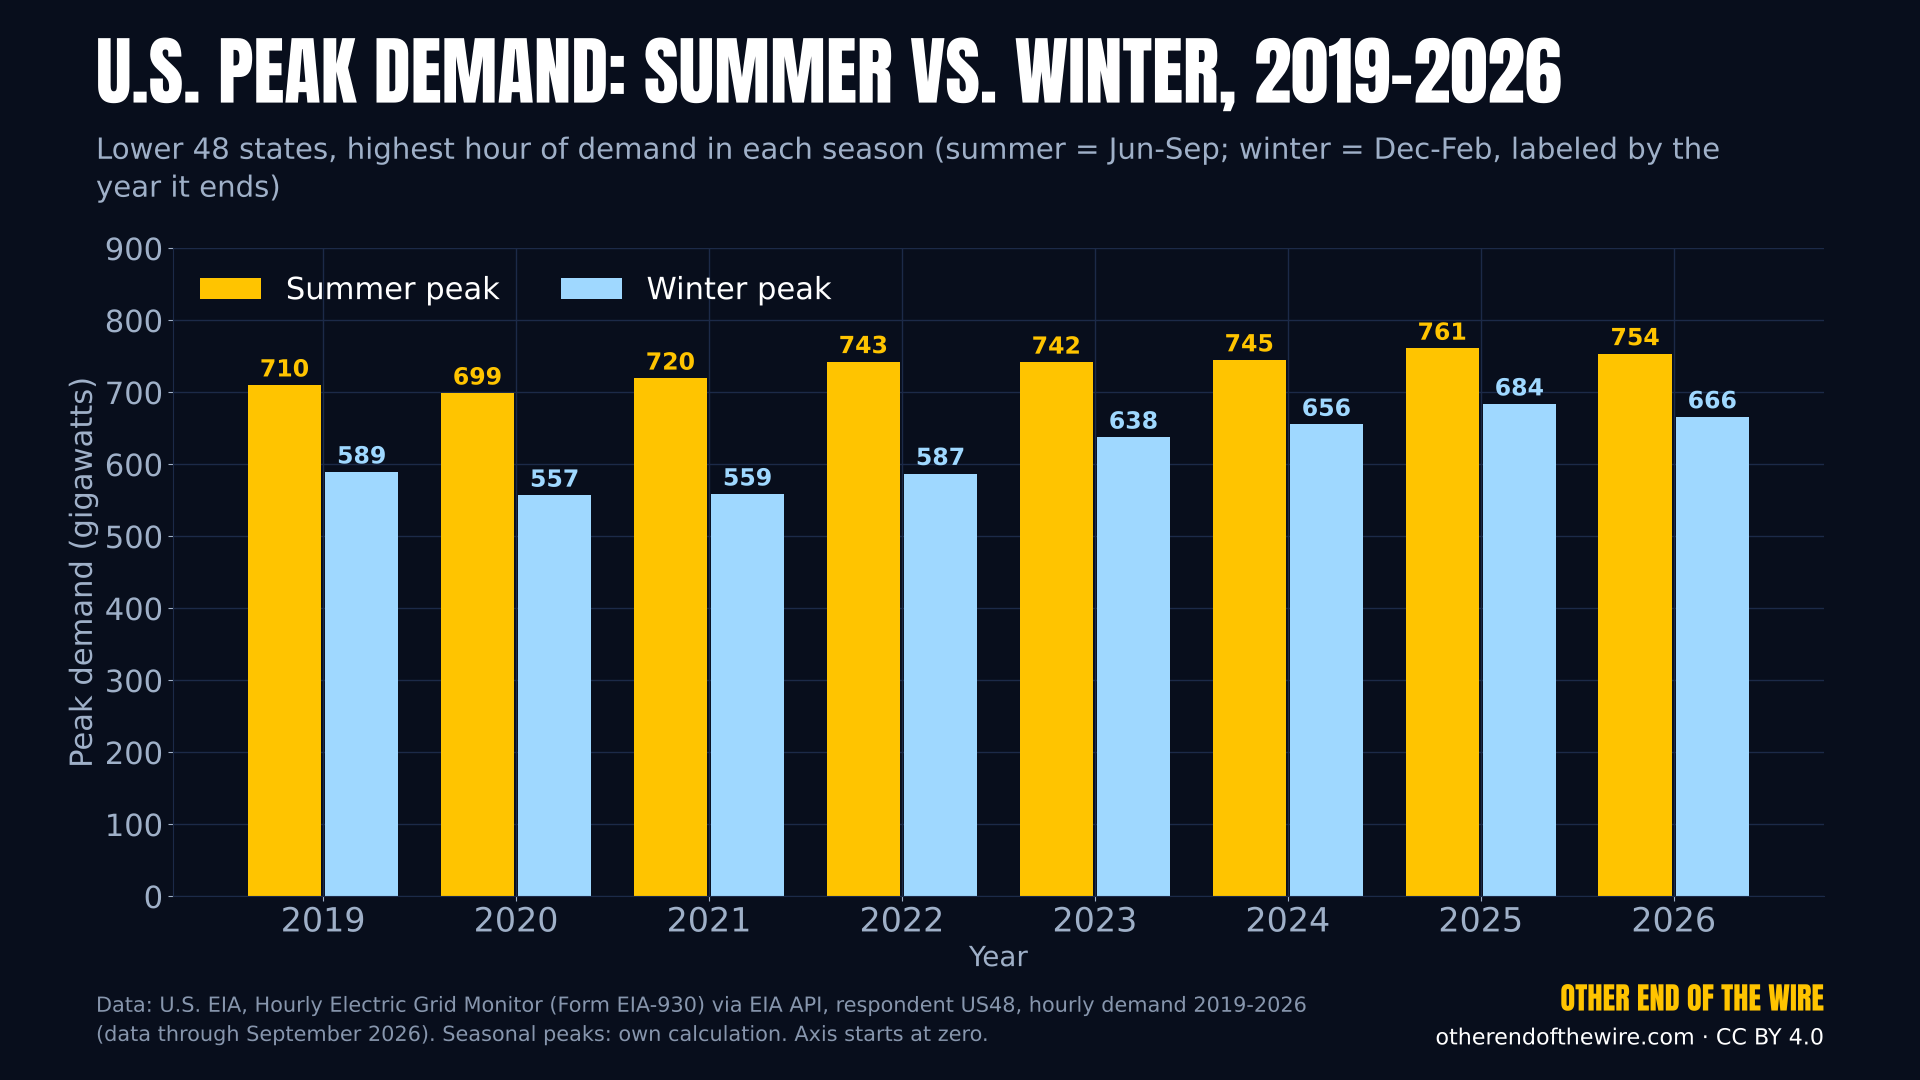
Paired bar chart of U.S. Lower 48 summer and winter peak demand 2019 to 2026; summer peaks 699 to 761 gigawatts, winter peaks 557 to 684 gigawatts.
U.S. peak electricity demand: summer vs. winter, 2019-2026Highest hourly electricity demand of the Lower 48 states in each summer (June-September) and each winter (December-February, labeled by the year in which the winter ends), 2019-2026, data through September 2026. Highest winter hour in this period: 684 GW on Jan 22, 2025; highest summer hour in this period: 761 GW on Jul 29, 2025.
Data: EIA, Hourly Electric Grid Monitor (Form EIA-930) via EIA API v2 electricity/rto/region-data, respondent US48, demand, hourly 2019-2026 [1] [2]
Data as of: Retrieved Nov 12, 2026; data through September 2026
From the video: Why 8 A.M. in Winter Is the Power Grid's Scariest Hour (planned Nov 24, 2026 (link follows after upload))
PNG (1920×1080)CSV dataCC BY 4.0
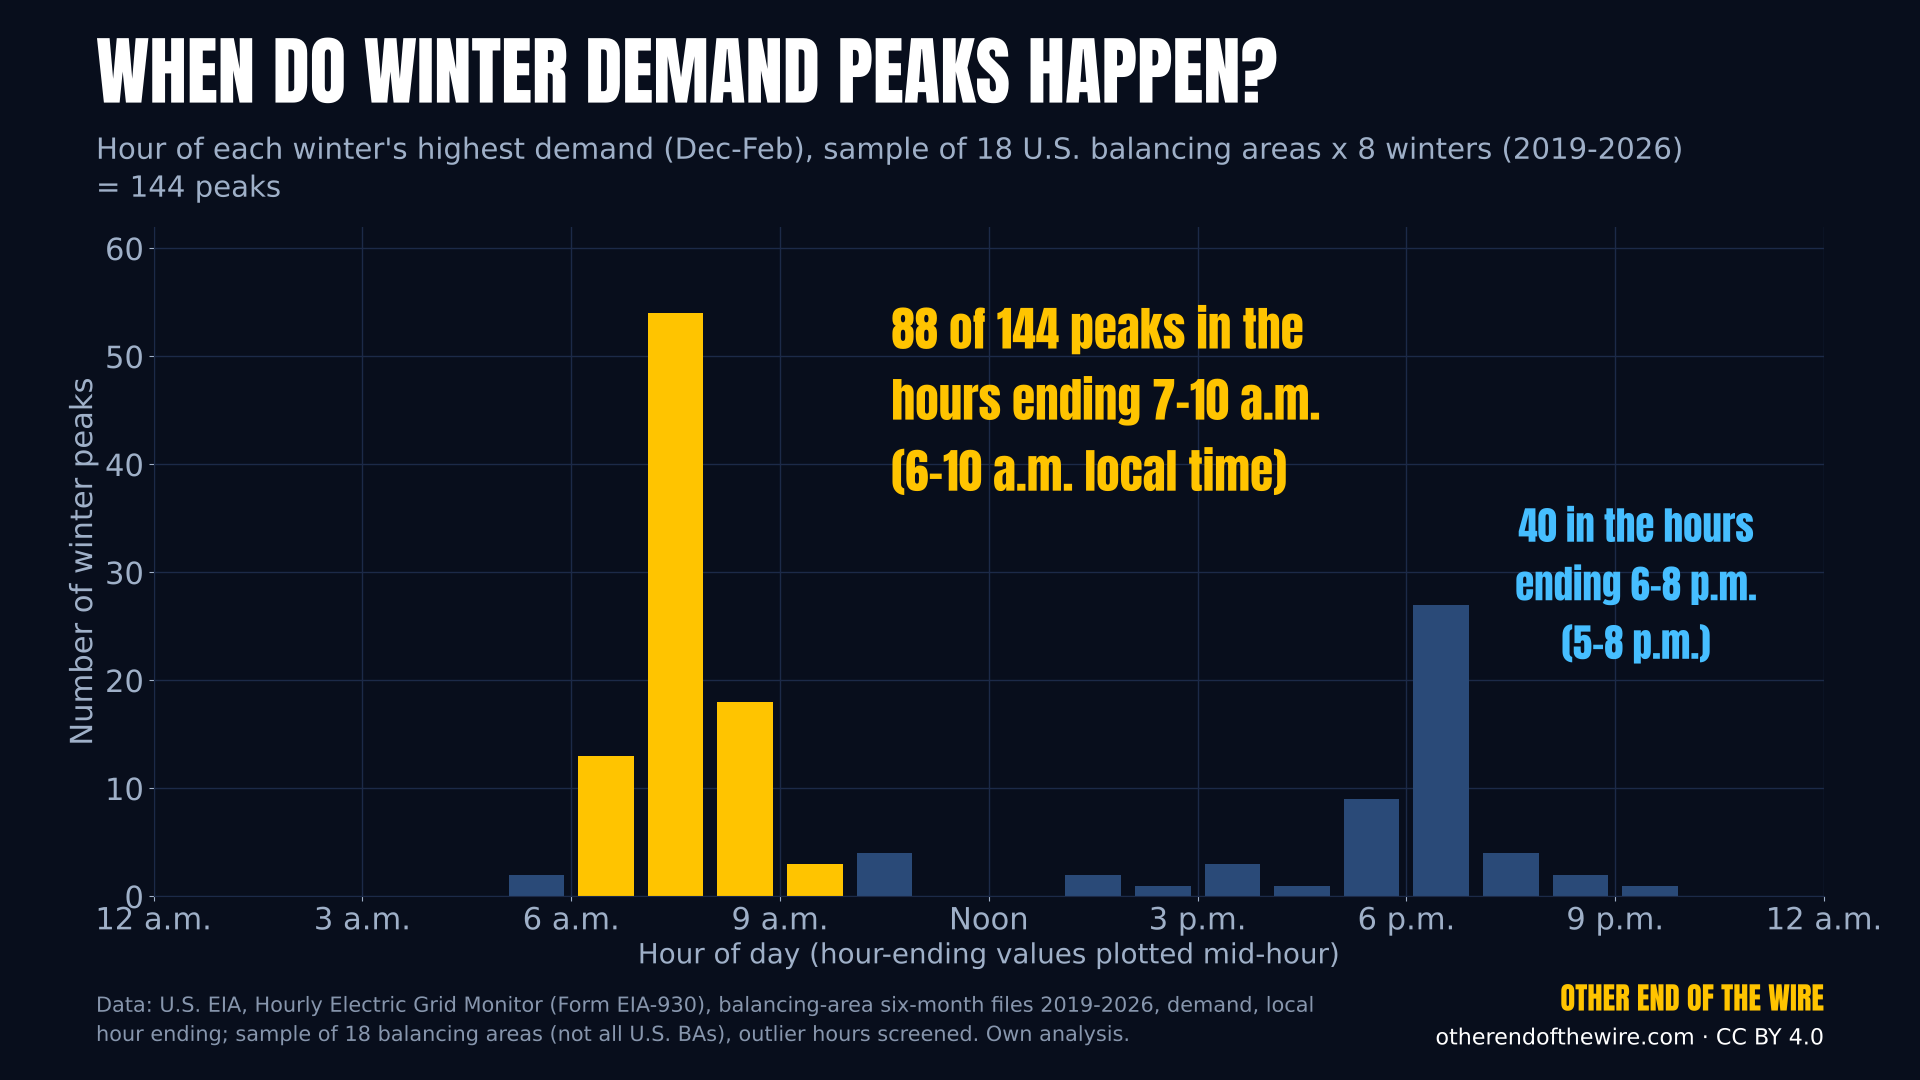
Histogram of the hour of 144 winter demand peaks: most between 6 and 10 a.m., a second smaller group in the early evening.
When do winter demand peaks happen? 18 U.S. grid regions, 2019-2026Hour (local time, hour ending) of each winter's highest electricity demand in a sample of 18 U.S. balancing areas (not all U.S. balancing areas; outlier hours screened) over 8 winters (2019-2026), 144 peaks in total. 88 of them fall in the hours ending 7-10 a.m. (6-10 a.m.), 40 in the hours ending 6-8 p.m. (5-8 p.m.). Balancing areas: AZPS, BPAT, CISO, CPLE, DUK, ERCO, FPL, ISNE, MISO, NYIS, PACE, PJM, PNM, SC, SCEG, SOCO, SWPP, TVA.
Data: EIA, Hourly Electric Grid Monitor (Form EIA-930), balancing-area six-month files 2019-2026, demand [1]
Data as of: Winters 2018/19-2025/26; downloaded Nov 12, 2026
From the video: Why 8 A.M. in Winter Is the Power Grid's Scariest Hour (planned Nov 24, 2026 (link follows after upload))
PNG (1920×1080)CSV dataCC BY 4.0

Only the charts on this page are released under CC BY 4.0. Video footage, thumbnails, the logo and other images are not. For other charts, contact us.