Video · November 10, 2026
Where Your Power Comes From at 3 A.M. vs. 3 P.M.
At 3 a.m., the U.S. grid can run on nuclear and wind. At 3 p.m., on solar. Why sunset is often the toughest hour, how the duck curve works, and why prices go negative.
Loads from YouTube (youtube-nocookie.com) only after you click play; YouTube’s privacy policy applies from then on.
Watch on YouTube · Narration is AI-generated; script researched and reviewed by a human.
What the video covers
Plug in your phone at 3 a.m., then again at 3 p.m. Same outlet, same wires, but very different power plants on the other end. This video follows one day on the U.S. grid using the U.S. Energy Information Administration’s hourly data.
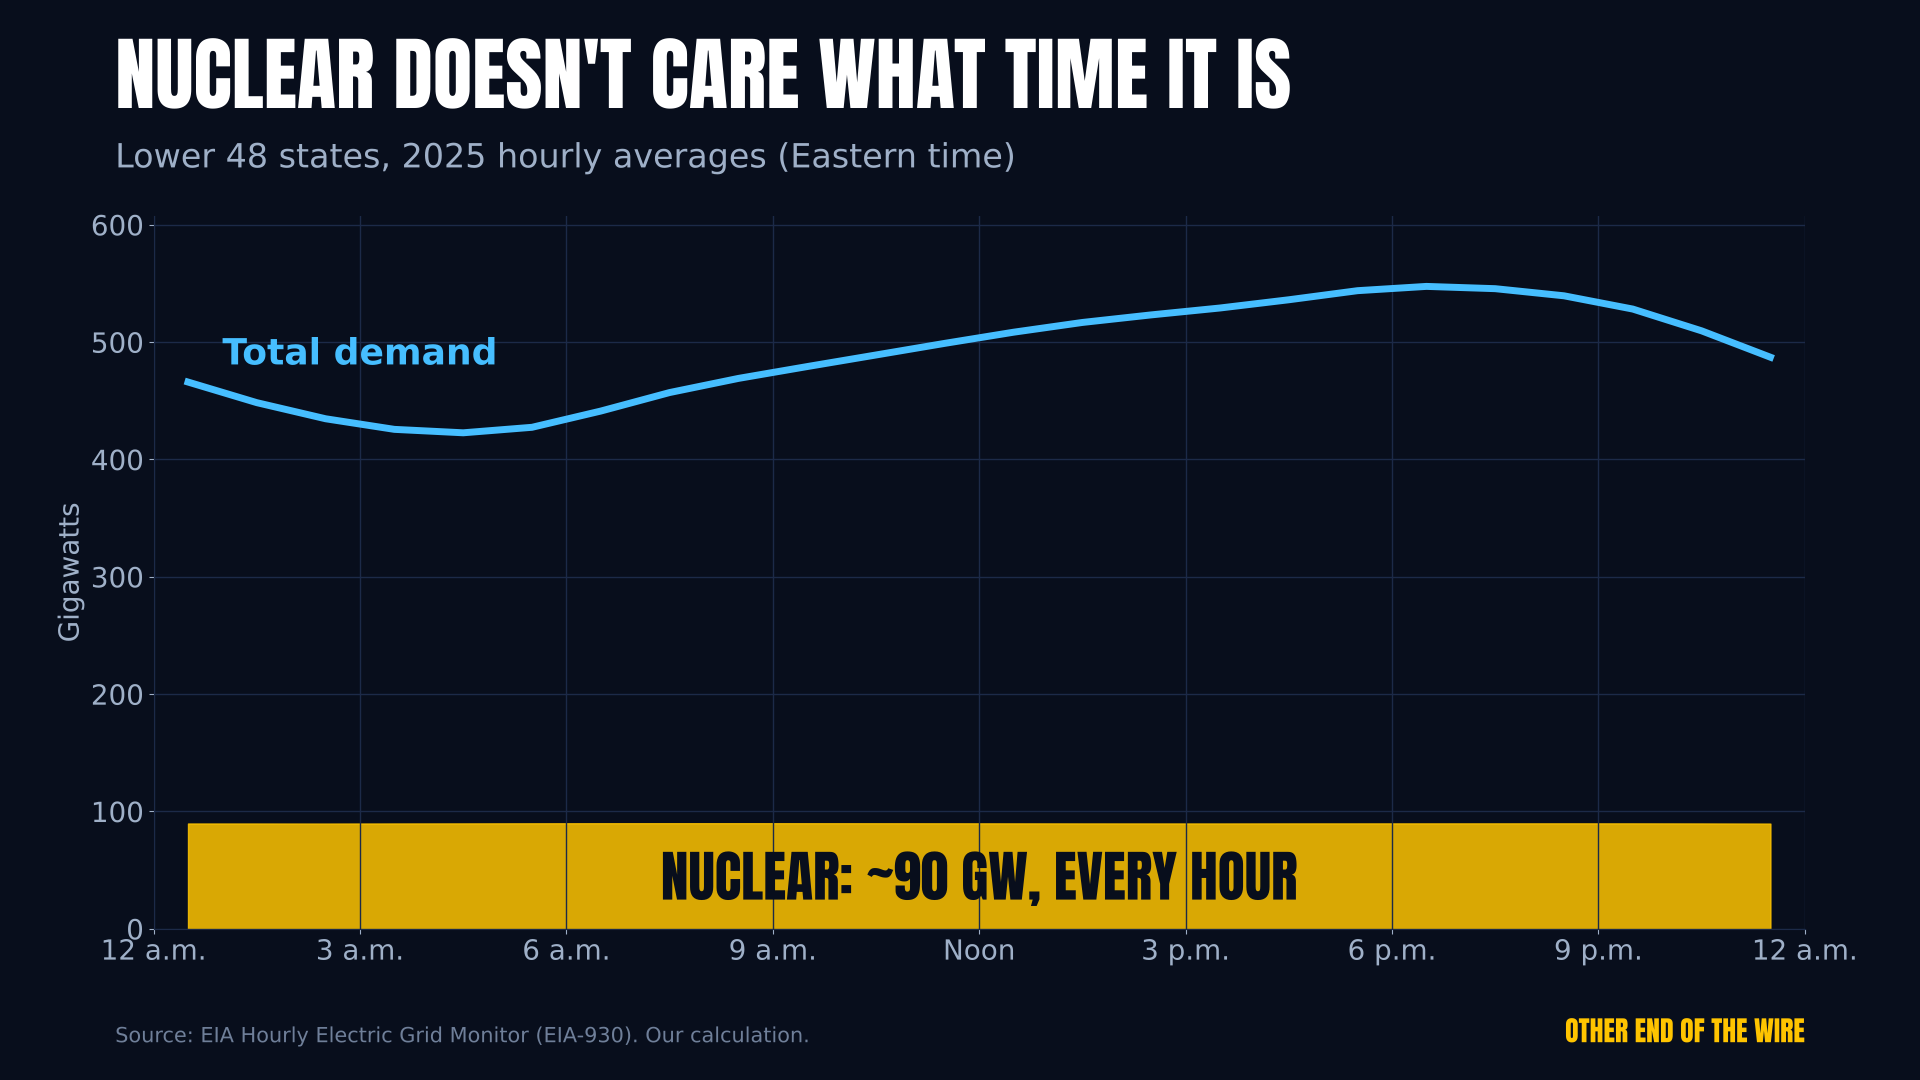
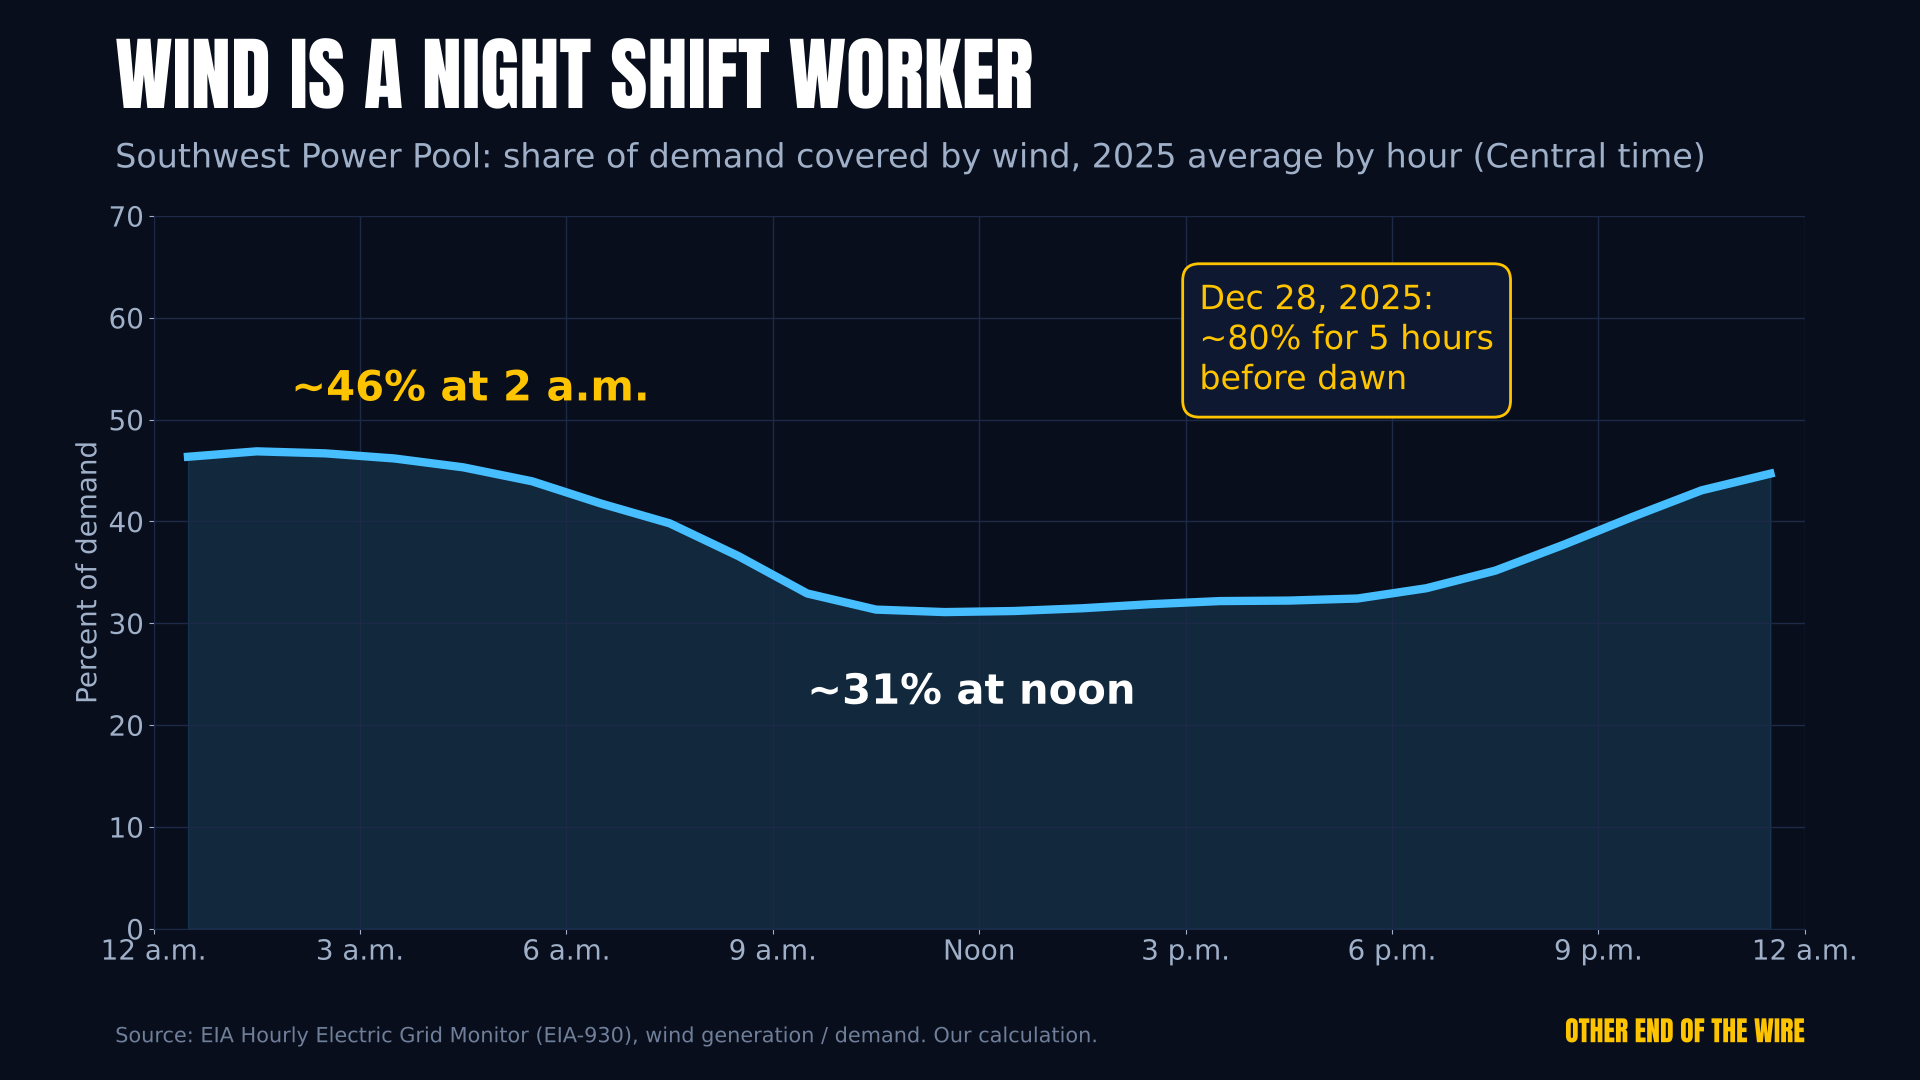
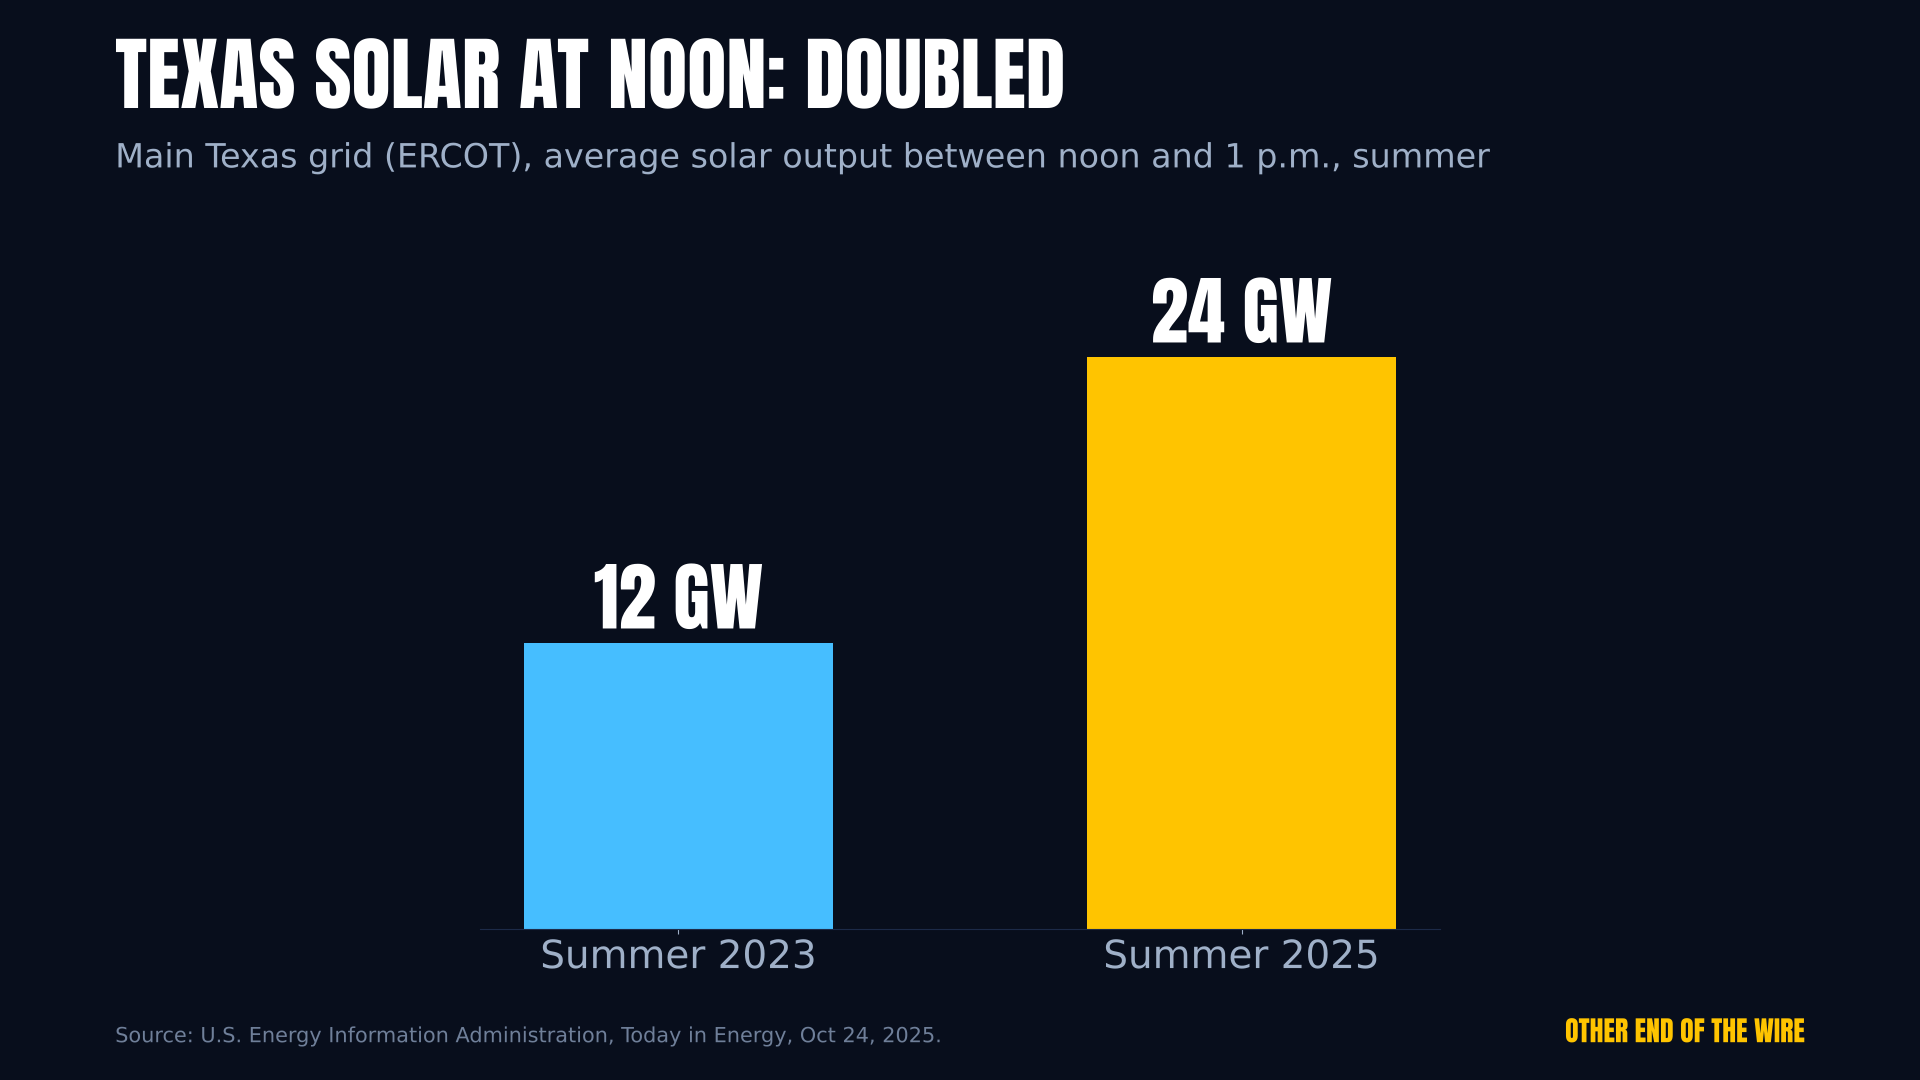
At night, demand bottoms out around 5 a.m. Nuclear plants run flat out at roughly 90 gigawatts every hour, and on the Great Plains wind is usually strongest overnight. In the afternoon, solar takes over in sunny states: Texas doubled its average noon solar output in two summers.
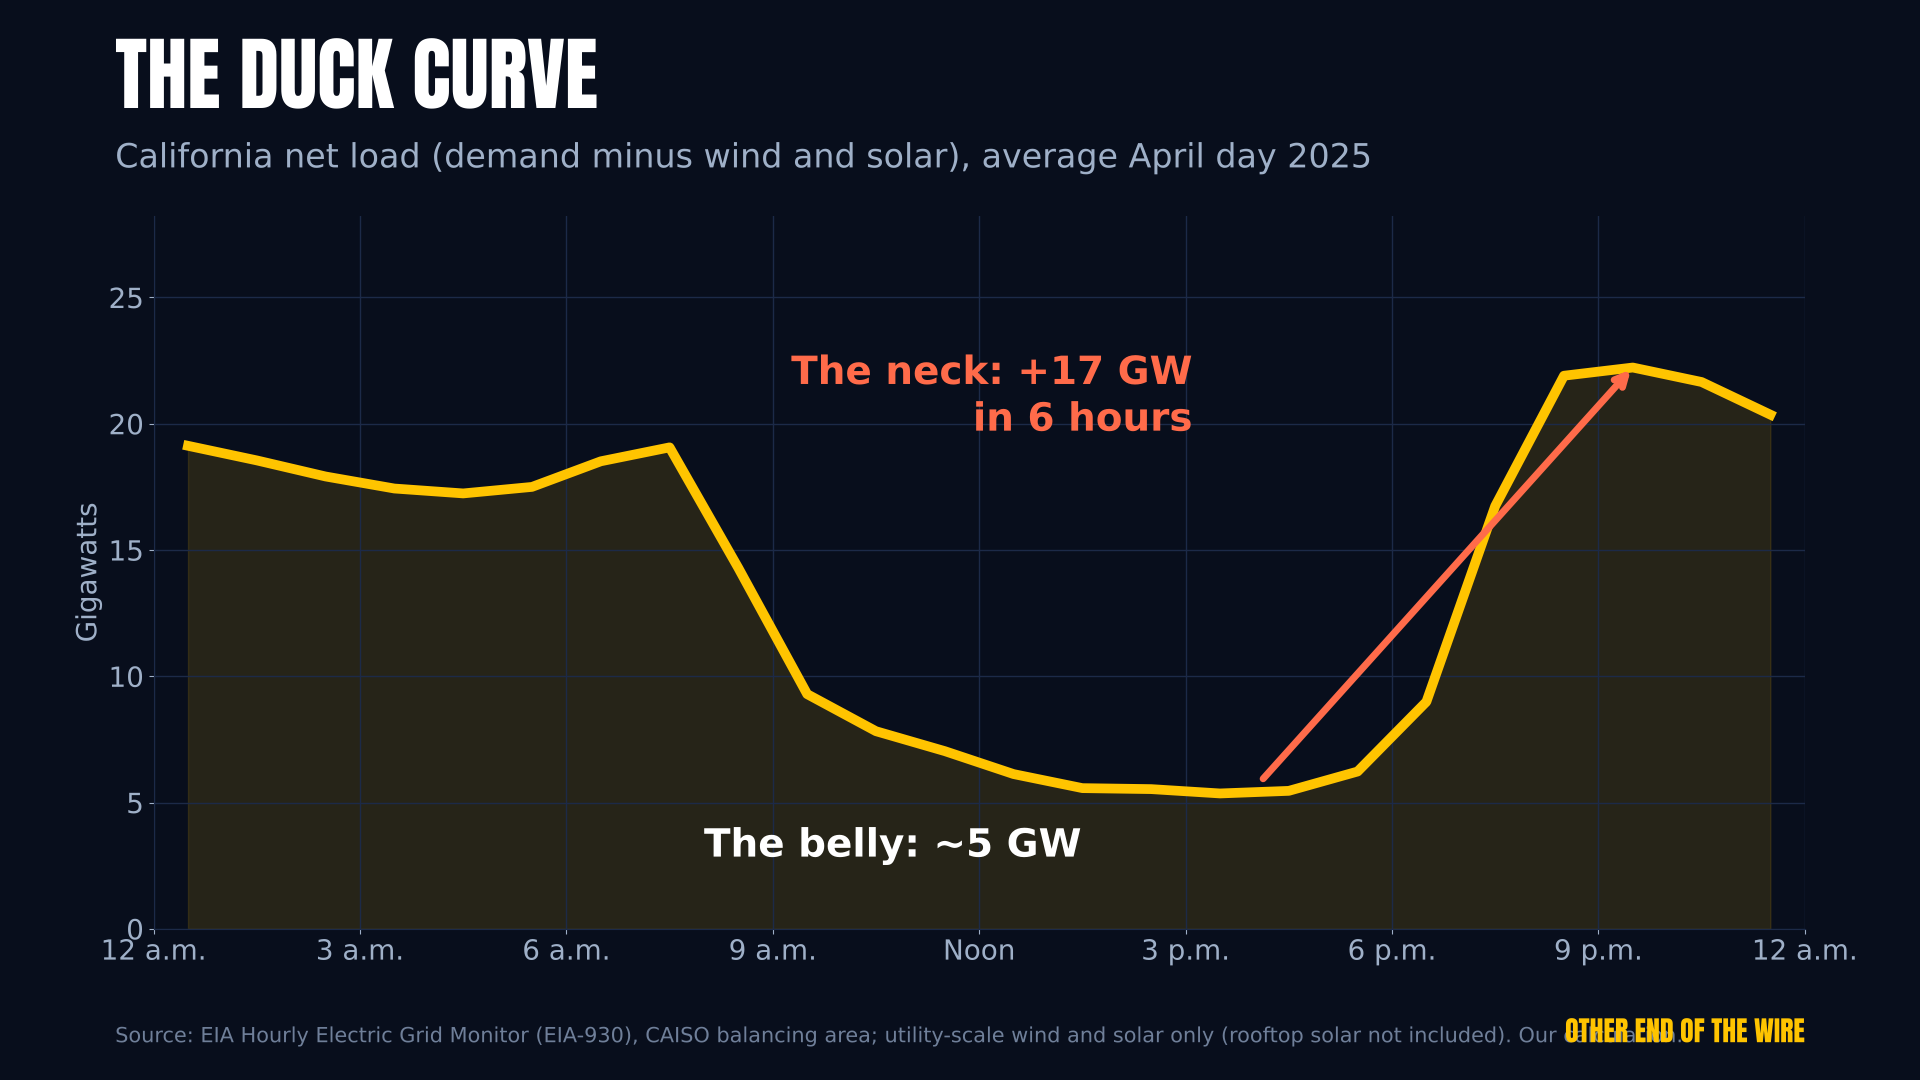
The hardest hour is often not the hottest one but the stretch around sunset, when solar fades while demand is still high: the duck curve. Batteries now shift part of the midday surplus into the evening, and wholesale prices can swing from above $500 to below $0 per megawatt-hour. At the end: what that means for your own timing at home.
Chapters
Our charts
Every chart in this video was built by us from the source data with our own code. No third-party images are shown here. Download the full-size PNG and, where we used raw data, the CSV behind it. A selection of our charts is free to reuse under CC BY 4.0. For other charts, please contact us.
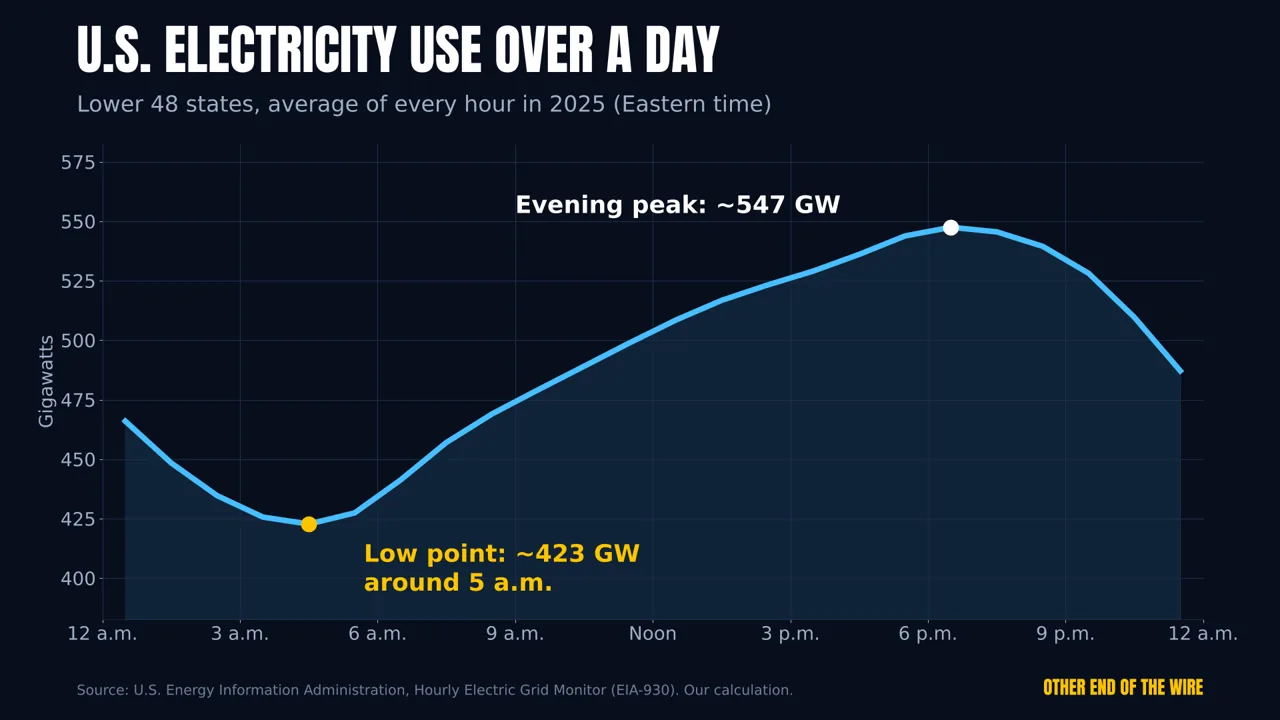
Source: U.S. EIA, Hourly Electric Grid Monitor (EIA-930). Our calculation.PNG (1920×1080)CSV: hourly_profiles_2025.csvCSV: eia930_us48_demand_2025_hourly.csv
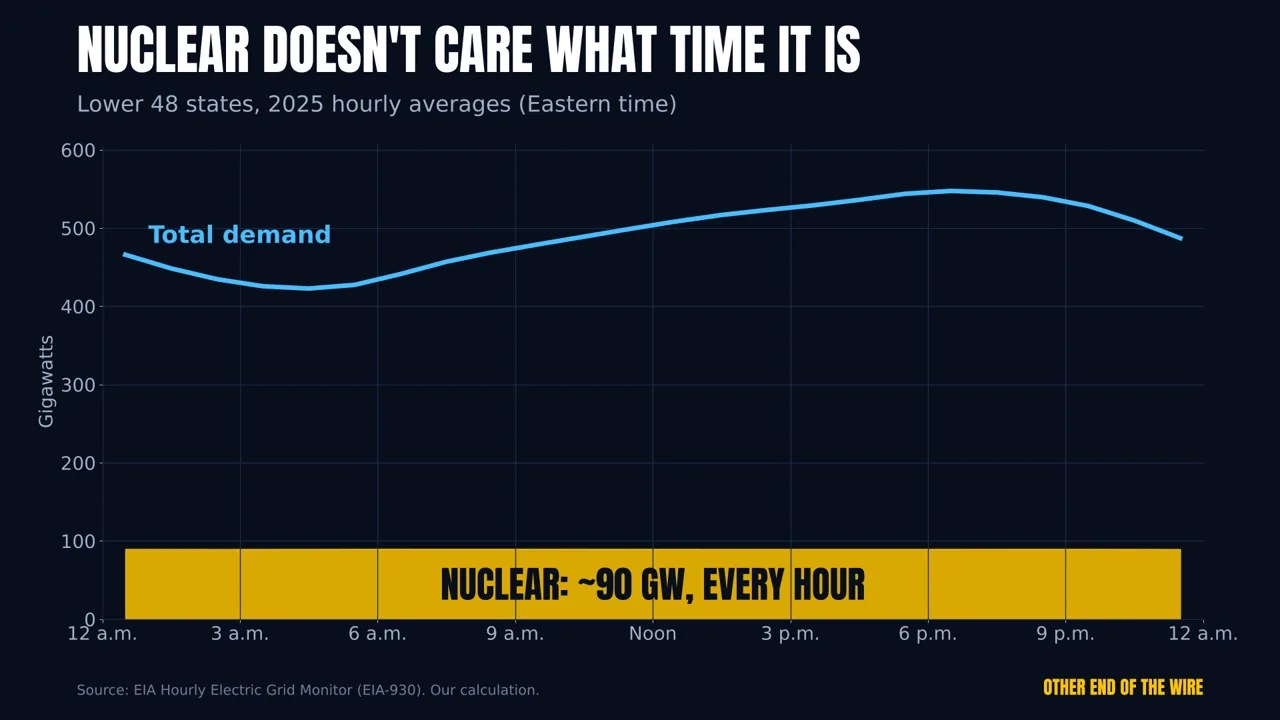
Source: U.S. EIA, Hourly Electric Grid Monitor (EIA-930). Our calculation.PNG (1920×1080)CSV: hourly_profiles_2025.csvCSV: eia930_us48_nuclear_2025_hourly.csv
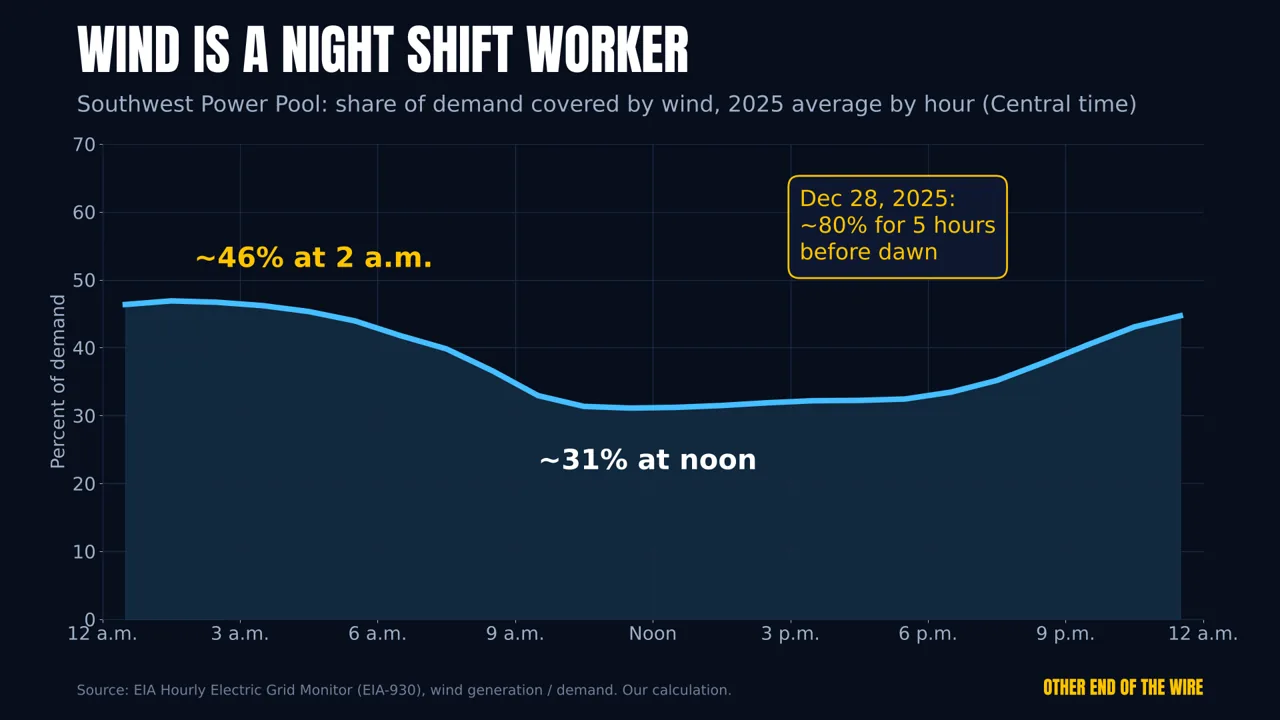
Source: U.S. EIA, Hourly Electric Grid Monitor (EIA-930), wind generation ÷ demand. Our calculation.PNG (1920×1080)CSV: hourly_profiles_2025.csvCSV: eia930_spp_wind_2025_hourly.csvCSV: eia930_spp_demand_2025_hourly.csv
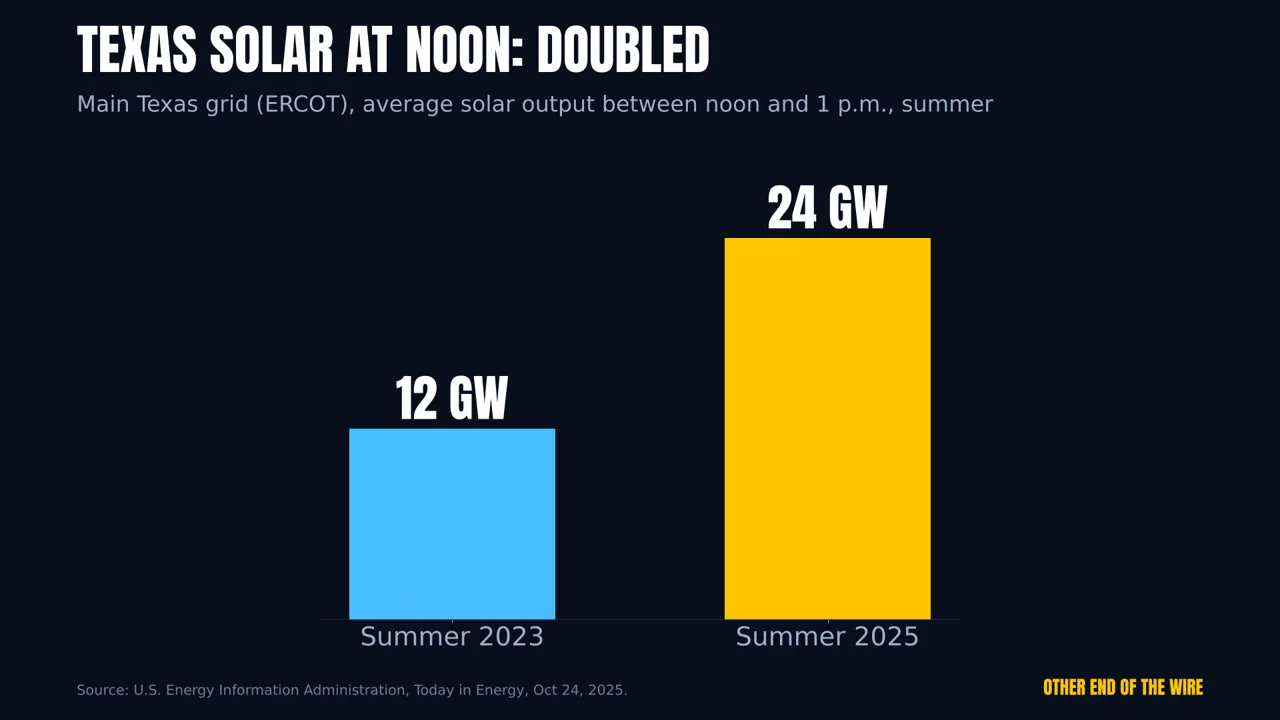
Source: U.S. EIA, Today in Energy, Oct 24, 2025.PNG (1920×1080)
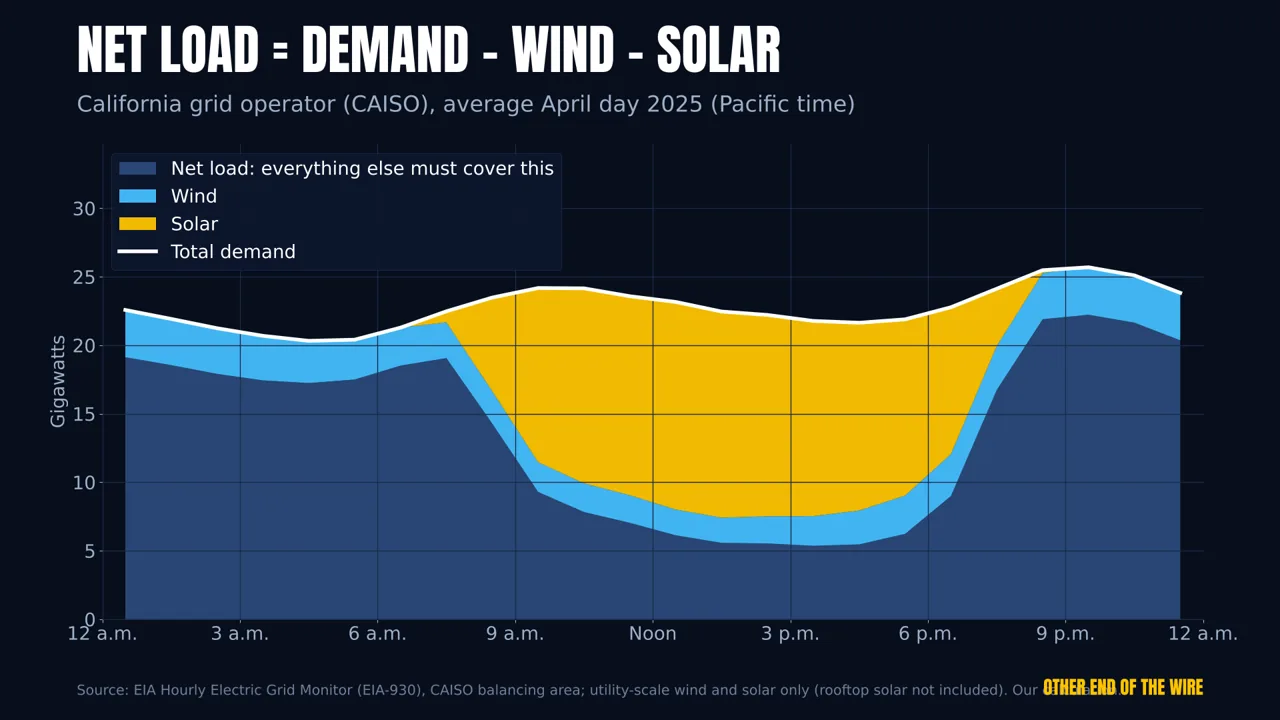
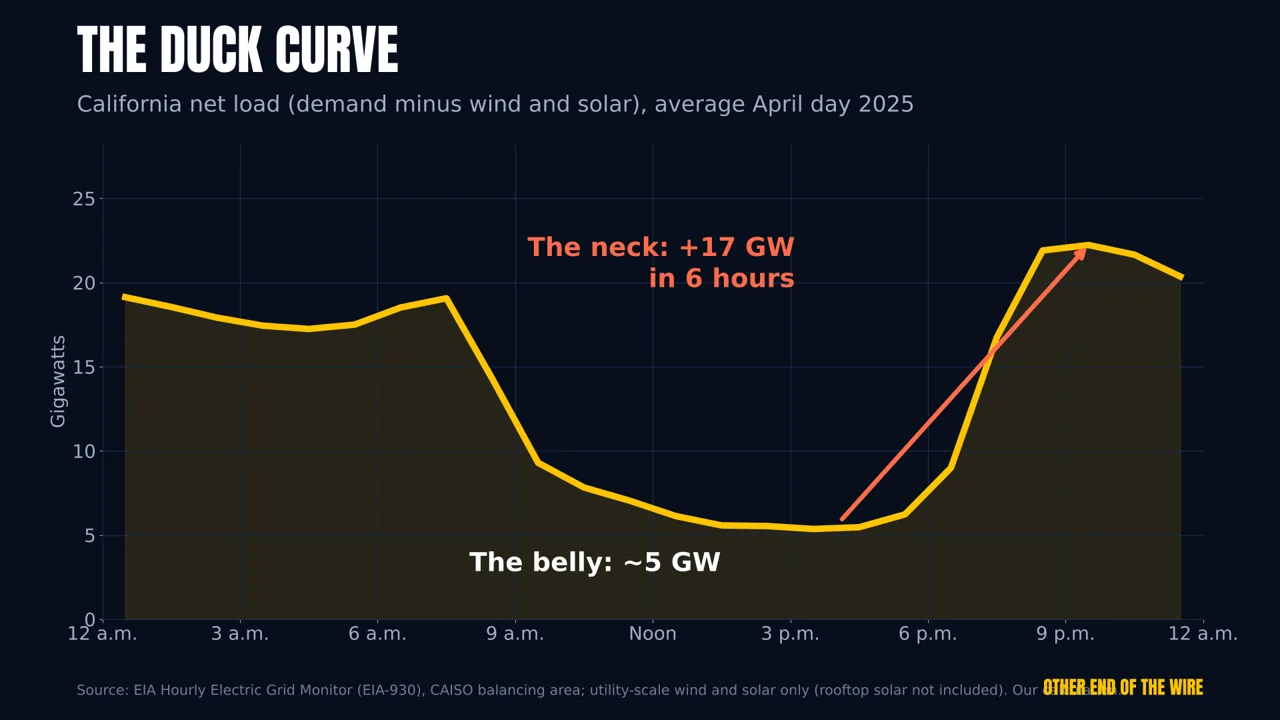
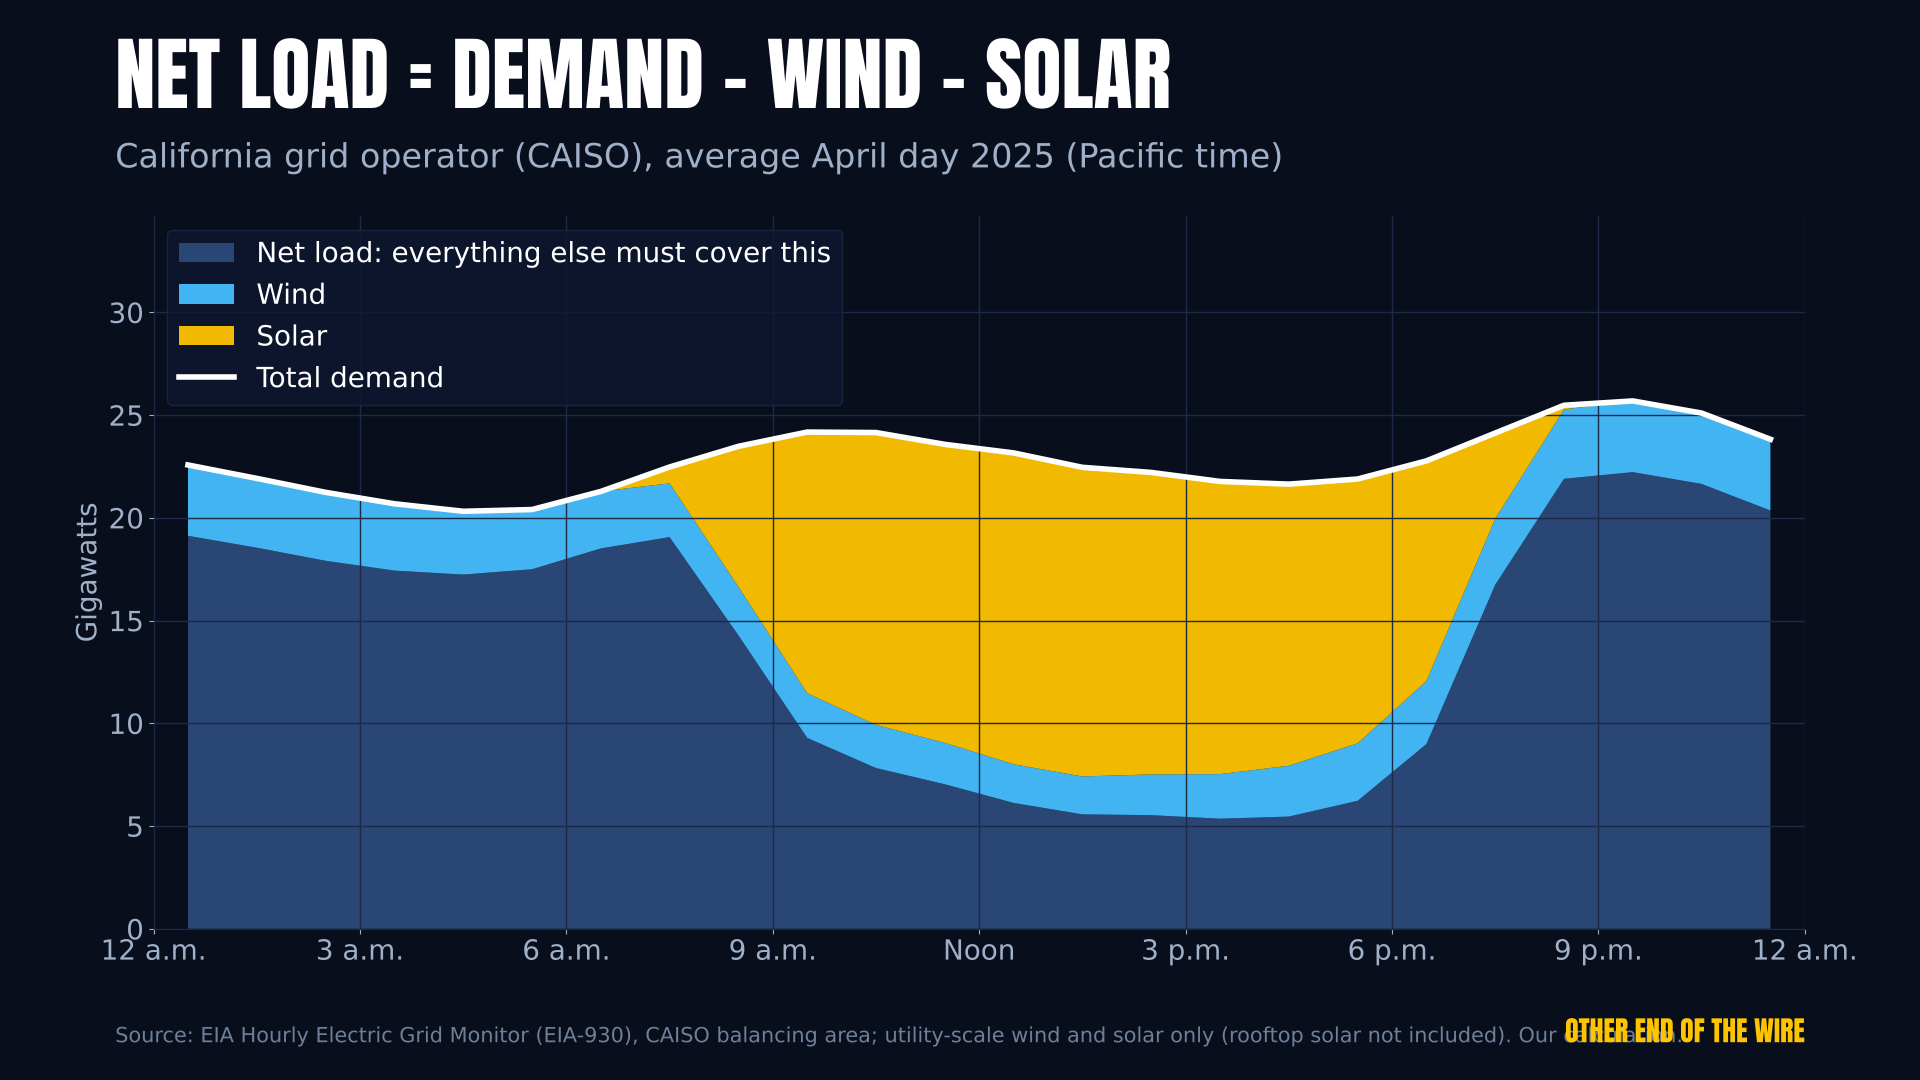
Source: U.S. EIA, Hourly Electric Grid Monitor (EIA-930), CAISO balancing area; utility-scale wind and solar only. Our calculation.PNG (1920×1080)CSV: caiso_april_2025_average_day.csv

Source: U.S. EIA, Hourly Electric Grid Monitor (EIA-930), CAISO balancing area. Our calculation.PNG (1920×1080)CSV: caiso_april_2025_average_day.csv
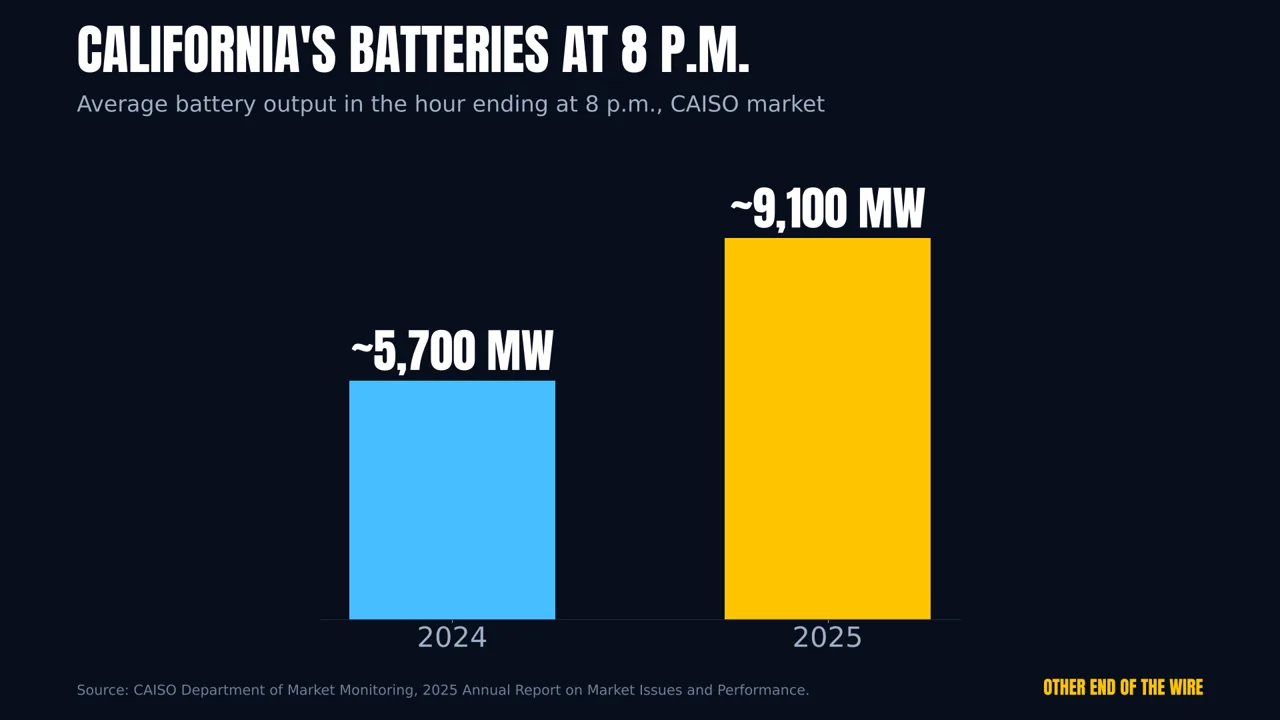
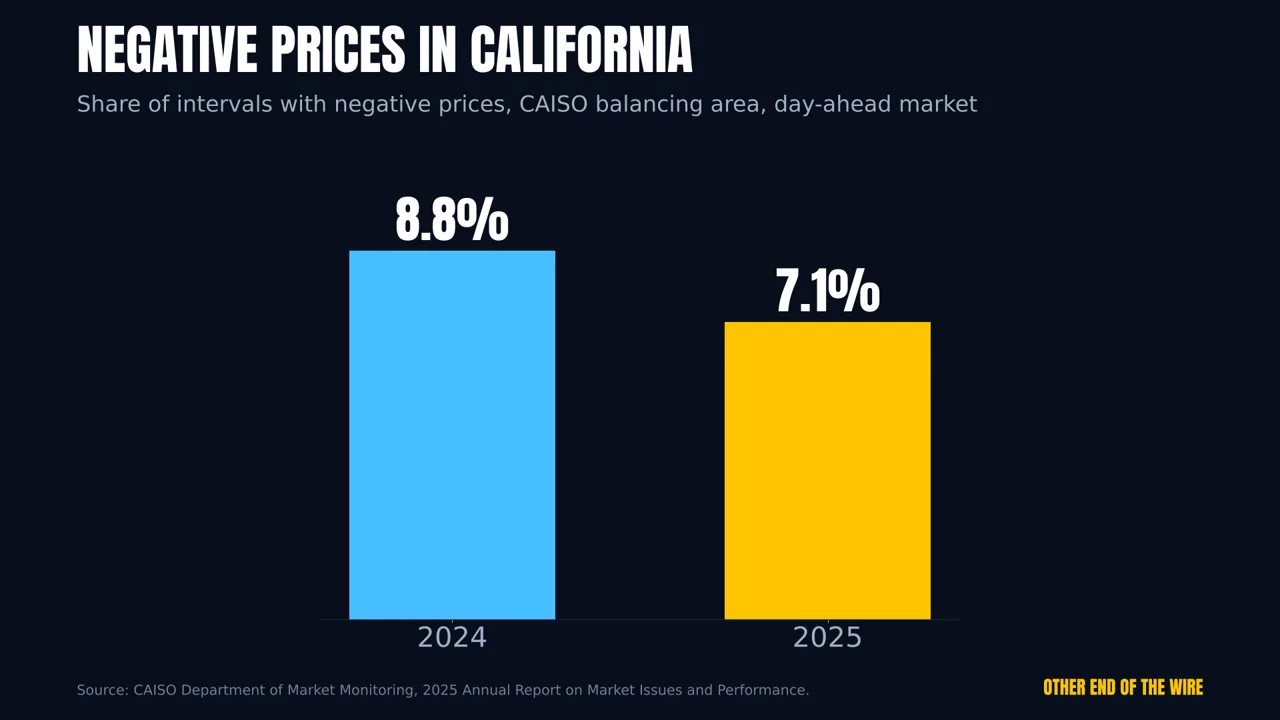
Source: California ISO Department of Market Monitoring, 2025 Annual Report on Market Issues and Performance.PNG (1920×1080)
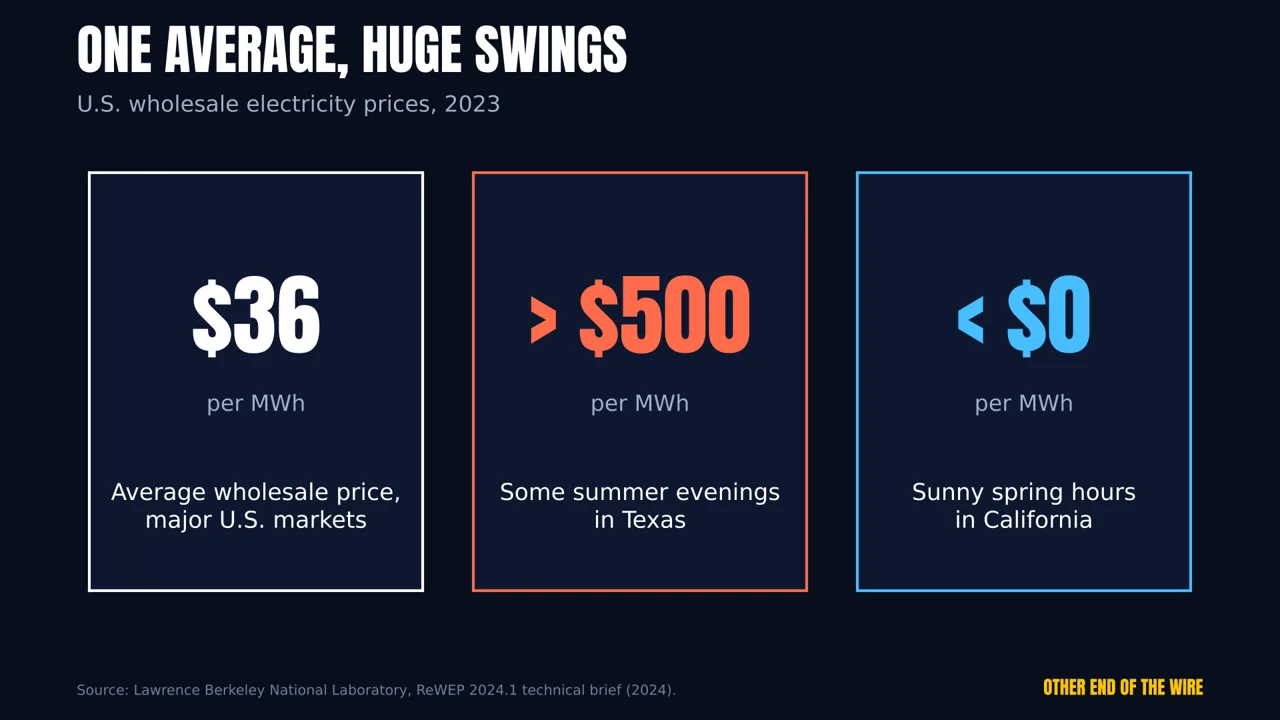
Source: Lawrence Berkeley National Laboratory, ReWEP 2024.1 technical brief (2024).PNG (1920×1080)
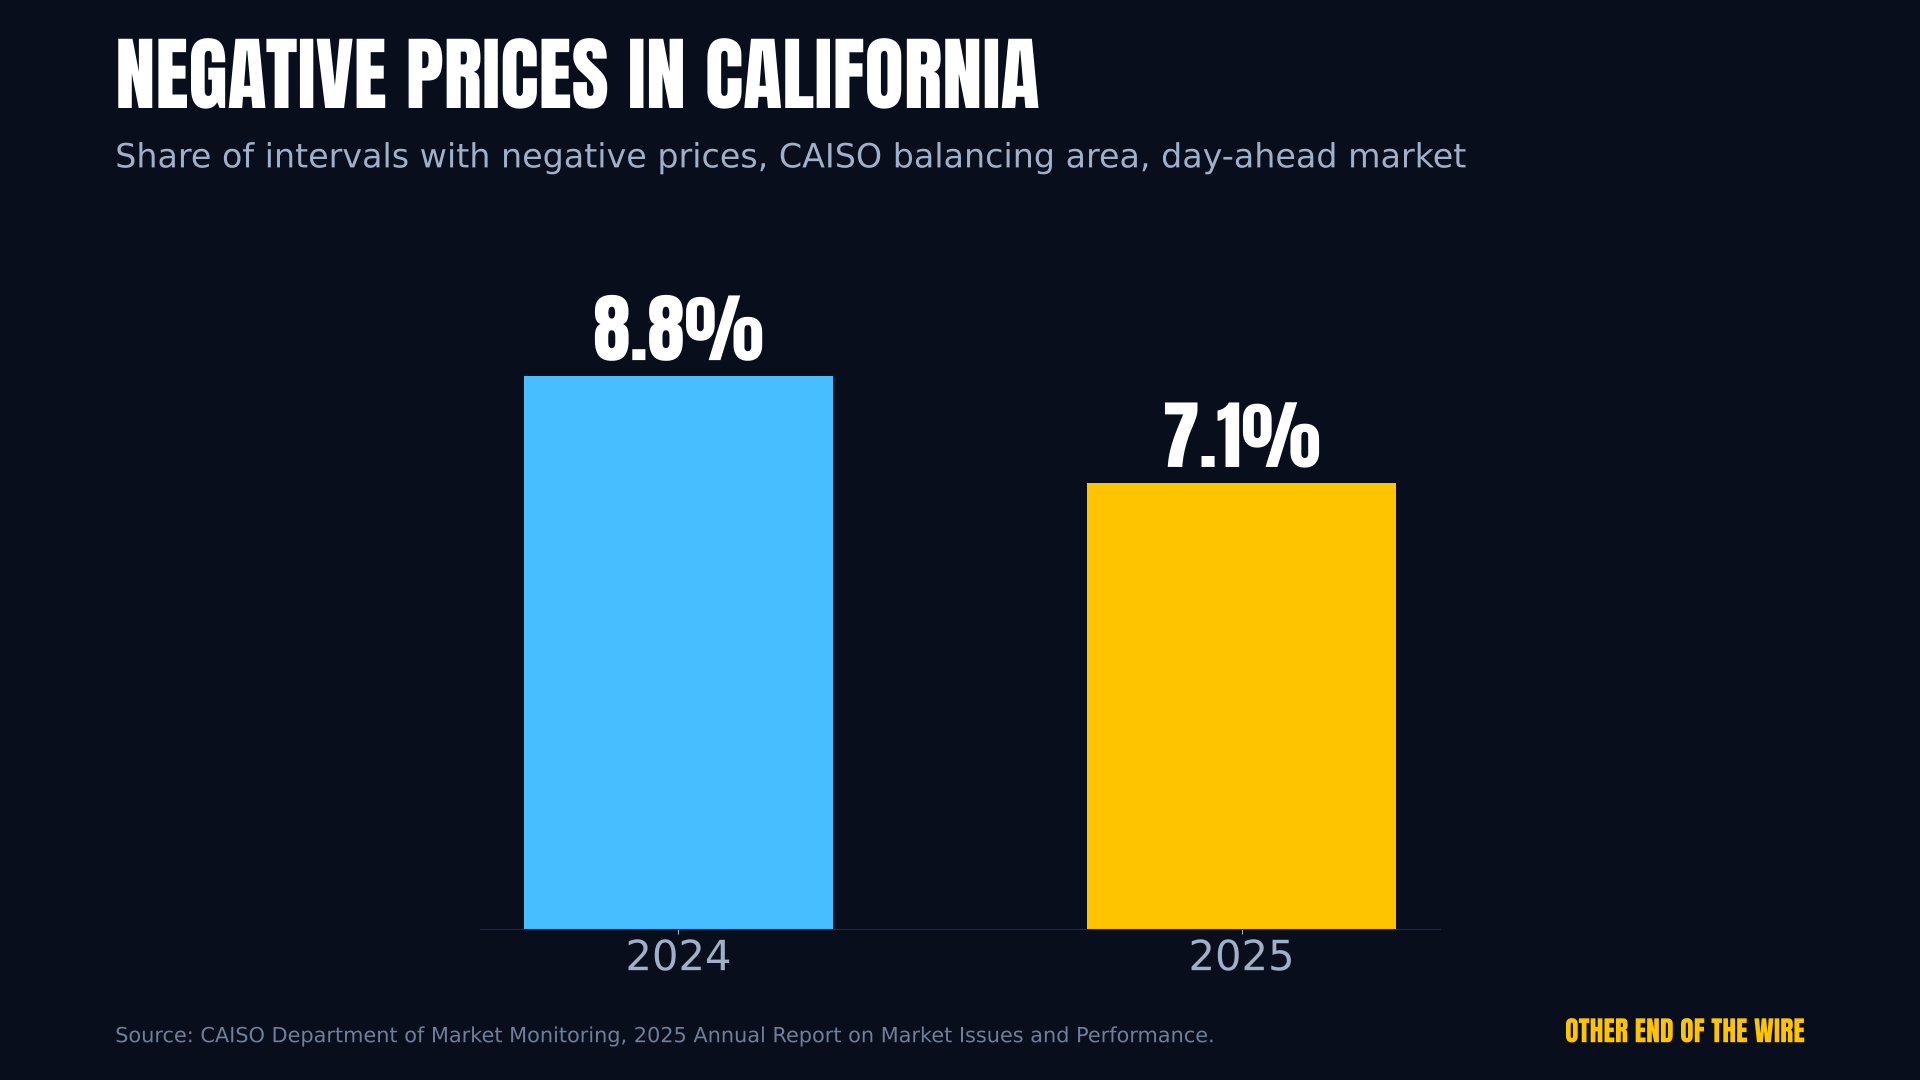
Source: California ISO Department of Market Monitoring, 2025 Annual Report on Market Issues and Performance.PNG (1920×1080)
All data files
- caiso_april_2025_average_day.csv
- eia930_caiso_demand_2025-04_hourly.csv
- eia930_caiso_solar_2025-04_hourly.csv
- eia930_caiso_wind_2025-04_hourly.csv
- eia930_spp_demand_2025_hourly.csv
- eia930_spp_wind_2025_hourly.csv
- eia930_us48_demand_2025_hourly.csv
- eia930_us48_nuclear_2025_hourly.csv
- hourly_profiles_2025.csv
Sources
Every number in the video traces back to the documents below. Primary sources first; we never take numbers from news articles.
- EIA, Today in Energy: Hourly electricity consumption varies throughout the day and across seasons (2020)https://www.eia.gov/todayinenergy/detail.php?id=42915
- EIA, Energy Explained: U.S. nuclear industry (capacity factor 2025)https://www.eia.gov/energyexplained/nuclear/us-nuclear-industry.php
- EIA, Energy Explained: Electricity in the U.S. (2025 generation shares)https://www.eia.gov/energyexplained/electricity/electricity-in-the-us.php
- EIA, Today in Energy: The central United States set several wind power records this spring (2020)https://www.eia.gov/todayinenergy/detail.php?id=44075
- EIA, Hourly Electric Grid Monitor / EIA-930 data (hourly demand, wind, solar, nuclear, 2025; our calculation)https://www.eia.gov/electricity/gridmonitor/
- EIA, Today in Energy: Why are Midwest grid operators turning away wind power? (2024)https://www.eia.gov/todayinenergy/detail.php?id=62406
- EIA, Today in Energy: ERCOT increasingly meets rising demand with solar, wind, and batteries (2025)https://www.eia.gov/todayinenergy/detail.php?id=66464
- EIA, Today in Energy: Solar and wind power curtailments are increasing in California (2025)https://www.eia.gov/todayinenergy/detail.php?id=65364
- EIA, Today in Energy: Solar generation in CAISO surpassed natural gas in the first five months of 2026https://www.eia.gov/todayinenergy/detail.php?id=67784
- EIA, Today in Energy: As solar capacity grows, duck curves are getting deeper in California (2023)https://www.eia.gov/todayinenergy/detail.php?id=56880
- California ISO Department of Market Monitoring, 2025 Annual Report on Market Issues and Performancehttps://www.caiso.com/documents/2025-annual-report-on-market-issues-and-performance.pdf
- EIA, Today in Energy: Batteries are a fast-growing secondary electricity source for the grid (2024)https://www.eia.gov/todayinenergy/detail.php?id=63025
- EIA, Today in Energy: Utility-scale batteries and pumped storage return about 80% of the electricity they store (2021)https://www.eia.gov/todayinenergy/detail.php?id=46756
- EIA, Today in Energy: Utility-scale batteries are more commonly used for price arbitrage (2025)https://www.eia.gov/todayinenergy/detail.php?id=66164
- Berkeley Lab, Exploring Wholesale Energy Price Trends: ReWEP 2024.1 technical brief (2024)https://eta-publications.lbl.gov/sites/default/files/rewep-2024update_tech-brief_20240429.pdf
- EIA, Today in Energy: negative wholesale electricity prices (Feb. 2012)https://www.eia.gov/todayinenergy/detail.php?id=5110
- EIA, Today in Energy: Negative wholesale electricity prices occur in RTOs (2012)https://www.eia.gov/todayinenergy/detail.php?id=6730
- EIA, Today in Energy: Natural gas-fired combustion turbines are generally used to meet peak electricity load (2013)https://www.eia.gov/todayinenergy/detail.php?id=13191
- EIA, Today in Energy: U.S. electric system is made up of interconnections and balancing authorities (2016)https://www.eia.gov/todayinenergy/detail.php?id=27152
- EIA, Today in Energy: The share of solar generation with co-located battery storage is increasing (2026)https://www.eia.gov/todayinenergy/detail.php?id=68384
- U.S. DOE Alternative Fuels Data Center: Charging Electric Vehicles at Homehttps://afdc.energy.gov/fuels/electricity-charging-home
- EIA, FAQ: How many smart meters are installed in the United States?https://www.eia.gov/tools/faqs/faq.php?id=108&t=3
- EIA, Today in Energy: nuclear plant capacity factor and baseload operation (June 8, 2011)https://www.eia.gov/todayinenergy/detail.php?id=1710
- EIA, Today in Energy: Texas natural gas output peaks in the evening as solar fades (Apr 9, 2024)https://www.eia.gov/todayinenergy/detail.php?id=61783
- EIA, Today in Energy: the Hourly Electric Grid Monitor (Dec 6, 2022)https://www.eia.gov/todayinenergy/detail.php?id=54899
- EIA, Hourly Electric Grid Monitor – About (data notes: demand excludes rooftop solar)https://www.eia.gov/electricity/gridmonitor/about
Claim-by-claim evidence (41 rows)
Research sheet, all sources opened and read on 2026-11-07. Statements are from the research version of the script; the final narration may be worded slightly differently.
| # | Statement in the script | Number | Source | Where in the source / quote |
|---|---|---|---|---|
| 1 | "According to the Energy Information Administration, U.S. electricity use typically bottoms out around five in the morning." | ~5 a.m. | https://www.eia.gov/todayinenergy/detail.php?id=42915 | EIA Today in Energy, Feb 21, 2020, para. 5: "Electricity consumption typically cycles each day with the lowest demand occurring around 5:00 a.m. and the highest demand occurring at some point during the day (depending on the season)" |
| 2 | "Refrigerators and other devices that run all the time keep going. The EIA calls that steady floor of demand baseload." | none | https://www.eia.gov/todayinenergy/detail.php?id=42915 | Para. 3: "The least amount of electricity is consumed at night when most people sleep. The generally constant amount of electricity demand is called baseload, which covers the energy used for appliances such as refrigerators and other electrical devices that run continuously." |
| 3 | "It's cheap to run once it's built, so operators try to keep it at full power around the clock." | none | https://www.eia.gov/todayinenergy/detail.php?id=1710 ; https://www.eia.gov/todayinenergy/detail.php?id=6730 | EIA June 8, 2011: "This is because nuclear capacity has very low variable costs." / "Baseload capacity runs around the clock when it is not down for maintenance." EIA June 18, 2012: "For technical and cost recovery reasons, nuclear plant operators try to continuously operate at full power." |
| 4 | "In 2025, the average U.S. nuclear plant ran at 91 percent of its maximum possible output, higher than any other kind of power plant, according to the EIA." | 91%, 2025 | https://www.eia.gov/energyexplained/nuclear/us-nuclear-industry.php | Section "Nuclear power plants are generally used more intensively than other power plants": "The average annual capacity factor for nuclear power plants in 2025 was 91%, which was higher than the capacity factors for other types of power plants." (Capacity factor = output ÷ maximum possible output, defined in EIA id=1710: "divided by the plant's maximum possible output. This ratio is known as the plant's capacity factor.") |
| 5 | "Nuclear supplied about 18 percent of the country's utility-scale electricity that year." | ~18%, 2025 | https://www.eia.gov/energyexplained/electricity/electricity-in-the-us.php | Heading "Nuclear energy provides the second-highest U.S. electricity source": "Nuclear energy accounted for about 18%—of U.S. utility-scale electricity generation in 2025." (Note: EIA's nuclear industry page says 17% in an AEO projection sentence; script uses the 18% utility-scale figure and says "about".) |
| 6 | "In the middle of the country, the EIA says land-based wind is usually strongest overnight. So wind records there tend to fall in the early morning hours." | none | https://www.eia.gov/todayinenergy/detail.php?id=44075 | EIA June 12, 2020, para. 6: "Land-based wind generation is greatest overnight, when stronger winds typically occur. As a result, wind power records tend to be set in the early hours of the morning." |
| 7 | "Take the Southwest Power Pool, the grid operator for a big stretch of the Great Plains. We ran its 2025 numbers from the EIA's hourly grid data. Averaged over the year, wind covered about 46 percent of demand at 2 a.m., but only about 31 percent at noon. And for five straight hours before dawn on December 28, 2025, it covered about 80 percent." | ~46% (2 a.m.), ~31% (noon), 2025 avg; ~80% Dec 28, 2025 | https://www.eia.gov/electricity/gridmonitor/ (data via EIA API v2 `electricity/rto/fuel-type-data` respondent=SWPP fueltype=WND and `electricity/rto/region-data` respondent=SWPP type=D, hourly, 2025-01-01 to 2025-12-31 Central) | Own calculation from EIA-930 primary data (critic, 2026-11-07). Hourly wind ÷ hourly demand, averaged by local hour (America/Chicago): 1 a.m. 46.4%, 2 a.m. 46.9%, 3 a.m. 46.7%; 11 a.m. 31.3%, noon 31.1%, 1 p.m. 31.2%. Dec 28, 2025, UTC 08–12 (2–6 a.m. CST): wind 22,565 / 22,178 / 21,886 / 21,926 / 22,117 MW vs. demand 27,690 / 27,388 / 27,270 / 27,397 / 27,820 MW = 81.5 / 81.0 / 80.3 / 80.0 / 79.5%. SPP 2025 wind share of net generation: 36.7% (consistent with row 8). Caveats: EIA-930 is operator-reported, not audited; ±1 h depending on hour-ending convention (values are flat across 1–3 a.m. and 11 a.m.–1 p.m., so the rounded figures hold either way). Rejected a higher Oct 11, 2025 reading (86.6%) because the preceding hours show stale repeated values (data gap). Replaces the 2020 record (72%, Apr 27, 2020, EIA id=44075), kept in "Cut" list below. |
| 8 | "In 2023, wind made up 36 percent of that grid's total generation." | 36%, 2023 | https://www.eia.gov/todayinenergy/detail.php?id=62406 | EIA June 26, 2024, para. 4: "In 2023, wind generation made up 36% of SPP's total generation and 15% of MISO's." |
| 9 | "Some nights there's more wind than anyone needs, so operators turn turbines down in the early morning to keep supply matched to demand." | none | https://www.eia.gov/todayinenergy/detail.php?id=62406 | Section "Managing oversupply": "The generation chart from April 7 shows how operators in SPP use wind curtailments in the early morning hours to reduce electricity supply closer to demand. In the evening, when system demand is higher, the need to curtail wind generation is eliminated entirely." |
| 10 | "The sun is high, air conditioners are running..." | none | https://www.eia.gov/todayinenergy/detail.php?id=42915 | Last para.: "Electricity consumption in the summer increases rapidly through the day along with temperature, reaching its maximum around 5:00 p.m. or 6:00 p.m." |
| 11 | "In the summer of 2025, solar plants on the main Texas grid averaged 24 gigawatts between noon and one p.m. Two summers earlier, it was 12. That's double in two years." | 24 GW (summer 2025); 12 GW (summer 2023); "double" | https://www.eia.gov/todayinenergy/detail.php?id=66464 | EIA Oct 24, 2025, para. 4: "Solar generators in ERCOT produced an average of 24 gigawatts (GW) between noon and 1:00 p.m. during the summer months of June through September compared with an average of 12 GW of solar generation at noon in the summer months of 2023." Calculation: 24 ÷ 12 = 2 → "double". "Main Texas grid": "the Texas electricity grid operated by the Electric Reliability Council of Texas (ERCOT)... which manages about 90% of the state's load". |
| 12 | "Gas supplied half of the Texas grid's midday power in the summer of 2023, and 37 percent in the summer of 2025." | 50% (2023); 37% (2025) | https://www.eia.gov/todayinenergy/detail.php?id=66464 | Para. 4: "Over the same period, the share of natural gas-fired generation at midday fell from 50% in 2023 to 37% in 2025." |
| 13 | "According to the EIA, solar now supplies almost half of the California grid operator's demand between eight in the morning and four in the afternoon." | almost half; 8 a.m.–4 p.m. | https://www.eia.gov/todayinenergy/detail.php?id=65364 | EIA May 28, 2025: "Solar energy supplies almost half of CAISO's electricity demand between the hours of 8:00 a.m. and 4:00 p.m." |
| 14 | "And in the first five months of 2026, utility-scale solar generated more electricity than natural gas on 82 percent of days on that grid, up from 21 percent in 2024 and 2025." | 82% (Jan–May 2026); 21% (2024, 2025) | https://www.eia.gov/todayinenergy/detail.php?id=67784 | EIA June 16, 2026, para. 2: "In CAISO, utility-scale solar generated more electricity than natural gas on a daily basis on 82% of days in the first five months of 2026, up from 21% in 2024 and 2025." |
| 15 | "So at 3 a.m. on the Great Plains, a big chunk of your power might be wind, and at 3 p.m. in California, close to half of it might be sunshine." | none (summary of rows 7, 13) | see rows 7, 13 | Critic fix: "largely on sunshine" overstated EIA's "almost half ... between 8:00 a.m. and 4:00 p.m." |
| 16 | "You'd think the toughest moment for the grid is the hottest afternoon, but often it isn't. It's the stretch around sunset." | none | https://www.eia.gov/todayinenergy/detail.php?id=56880 ; https://www.eia.gov/todayinenergy/detail.php?id=61783 | EIA June 21, 2023: "The first challenge is grid stress. The extreme swing in demand for electricity from conventional power plants from midday to late evenings, when energy demand is still high but solar generation has dropped off, means that conventional power plants (such as natural gas-fired plants) must quickly ramp up..." EIA Apr 9, 2024 (Texas): "Electricity output from natural gas-fired power plants is often greatest in the evening between 6:00 p.m. and 8:00 p.m." |
| 17 | "That's total demand minus whatever wind and solar are producing." | none | https://www.eia.gov/todayinenergy/detail.php?id=56880 | Para. 1: "net load (or the demand remaining after subtracting variable renewable generation)" |
| 18 | "Plot net load over a typical day in California and it sags deep in the middle, then shoots up steeply in the evening. It looks like the outline of a duck, so it's called the duck curve. And the EIA says the belly keeps getting deeper as solar grows." | none | https://www.eia.gov/todayinenergy/detail.php?id=56880 | Para. 1: "When graphed for a typical day, the pattern created by the midday dip in the net load curve, followed by a steep rise in the evenings when solar generation drops off, looks like the outline of a duck, so this pattern is often called a duck curve. As solar capacity in California continues to grow, the midday dip in net load is getting lower" |
| 19 | "...in spring, when it's mild and demand is low, there can be more solar than the grid can use. In 2024, California's grid operator curtailed 3.4 million megawatt-hours of wind and solar, 29 percent more than in 2023. Solar was 93 percent of it." | 3.4 million MWh; +29%; 93%; 2024 | https://www.eia.gov/todayinenergy/detail.php?id=65364 | EIA May 28, 2025: "In 2024, CAISO curtailed 3.4 million megawatthours (MWh) of utility-scale wind and solar output, a 29% increase from the amount of electricity curtailed in 2023." / "Solar accounted for 93% of all the energy curtailed in CAISO in 2024. CAISO curtailed the most solar in the spring, when solar output was relatively high and electricity demand was relatively low, because moderate spring temperatures meant less demand for space heating or air conditioning." |
| 20 | "As solar fades around sunset, people get home, cook dinner and turn on lights and air conditioners. Everything that isn't the sun has to ramp up fast." | none | https://www.eia.gov/todayinenergy/detail.php?id=65364 ; https://www.eia.gov/todayinenergy/detail.php?id=56880 | id=65364: "demand increases in the later evening hours when people come home from work and turn up air conditioners or electric heaters and turn on lights, ovens, computers, and televisions." id=56880: "conventional power plants (such as natural gas-fired plants) must quickly ramp up electricity production" |
| 21 | "One fast-growing answer is a battery." | none | https://www.eia.gov/todayinenergy/detail.php?id=63025 | EIA Sep 5, 2024: "Utility-scale battery energy storage systems have been growing quickly as a source of electric power capacity in the United States in recent years." |
| 22 | "The EIA puts it neatly: storing midday solar flattens the duck's curve, and sending it out in the evening shortens the duck's neck." | none | https://www.eia.gov/todayinenergy/detail.php?id=56880 | "Storing some midday solar generation flattens the duck's curve, and dispatching the stored solar generation in the evening shortens the duck's neck." |
| 23 | "California's grid operator reported that in 2025, batteries in its market delivered about 9,100 megawatts on average in the hour ending at 8 p.m. In 2024, that figure was about 5,700." | ~9,100 MW (2025); ~5,700 MW (2024); hour-ending 20 | https://www.caiso.com/documents/2025-annual-report-on-market-issues-and-performance.pdf | CAISO Department of Market Monitoring, 2025 Annual Report on Market Issues and Performance (June 2026), Ch. 1, text above Fig. 1.61: "The average net energy output from batteries peaked at about 9,100 MW during hour-ending 20 in 2025, compared to 5,700 MW in 2024." (Hour-ending 20 = 7:00–8:00 p.m.) |
| 24 | "In the summer of 2025, batteries on its main grid supplied an average of 4 gigawatts in the 8 p.m. hour, right as the solar output was fading." | 4 GW; summer 2025; 8 p.m. hour | https://www.eia.gov/todayinenergy/detail.php?id=66464 | Para. 5: "In the summer months of 2025, batteries helped supply electricity in the evening as solar output declined, supplying an average of 4 GW in the 8:00 p.m. hour." |
| 25 | "In 2019, the EIA found the U.S. battery fleet gave back about 82 percent of the electricity put into it." | 82%, 2019 | https://www.eia.gov/todayinenergy/detail.php?id=46756 | EIA Feb 12, 2021, para. 1: "in 2019, the U.S. utility-scale battery fleet operated with an average monthly round-trip efficiency of 82%". Also: "Energy storage systems use more electricity for charging than they provide" (id=63025). |
| 26 | "In 2024, 41 percent of U.S. utility-scale battery capacity was used mainly for arbitrage. That's a fancy word for charging when power is cheap and selling it back when it's expensive." | 41%, 2024 | https://www.eia.gov/todayinenergy/detail.php?id=66164 | EIA Sep 22, 2025: "Last year, operators responded that 66% of all utility-scale battery capacity had arbitrage among its uses and that 41% of the total capacity was primarily used for arbitrage." / "Arbitrage involves buying electricity when prices are relatively low and selling that electricity when prices are high." ("Last year" = 2024 survey year; article also says "At the end of 2024...") |
| 27 | "Berkeley Lab found that the average wholesale price across the major U.S. power markets in 2023 was 36 dollars per megawatt-hour." | $36/MWh, 2023 | https://eta-publications.lbl.gov/sites/default/files/rewep-2024update_tech-brief_20240429.pdf | LBNL technical brief "Exploring Wholesale Energy Price Trends: ReWEP Version 2024.1" (May 2024), p. 2: "Figure 1, available from ReWEP, shows the average price in 2023 was $36/MWh, down from $63/MWh in 2022." Fig. 1 note: prices "are calculated based on all nodes and hours within each of the 7 major ISOs/RTOs, and represent hourly average prices in the real time markets." |
| 28 | "But that average hides huge swings. That year in Texas, hourly prices on some summer evenings topped 500 dollars. In California, on sunny spring days, they dropped below zero." | >$500/MWh (ERCOT, summer evenings 2023); <$0 (CAISO, spring daytime 2023) | same LBNL PDF | p. 3, Fig. 4 caption: "Prices in ERCOT (Texas) peaked in the summer early evening periods coinciding with record high electricity demand" – heat map shows hot-pink (>$500/MWh, regional average hourly price) cells in Jul–Sep around 6 p.m. Fig. 3 (CAISO): "prices declined to minimum levels during spring daytime hours flush with solar and hydropower generation resources" with light-blue (<$0) cells Apr–Jun midday. Critic fix: earlier draft said CAISO ranged "from over 500 dollars"; the CAISO heat map shows no visible >$500 cells (its January peak is in the >$150 band); the ">$500" in the shared caption is a legend value, so the high end was moved to Texas. |
| 29 | "A negative price means sellers are paying buyers to take their power." | none | https://www.eia.gov/todayinenergy/detail.php?id=5110 | EIA Feb 23, 2012: "Wholesale electricity markets sometimes result in prices below zero. That is, sellers pay buyers to take the power." |
| 30 | "The EIA explains that some plants can't easily or cheaply shut down for a short stretch. Nuclear operators try to run at full power, and big steam plants face costs every time they stop and restart." | none | https://www.eia.gov/todayinenergy/detail.php?id=6730 | EIA June 18, 2012: "some types of generators, such as those providing nuclear, hydroelectric, or wind energy, cannot or prefer not to reduce output for short periods of time" / "nuclear plant operators try to continuously operate at full power." / "There are maintenance and fuel-cost penalties when operators shut down and start up large steam turbine (usually fossil-fueled) plants" |
| 31 | "And some wind farms earn a tax credit for every megawatt-hour they produce, so they may keep running even when the price dips below zero. For a short stretch, paying a little beats shutting down." | none (no $ figure used; the 2012 PTC value is outdated, so cut) | https://www.eia.gov/todayinenergy/detail.php?id=6730 | "Eligible renewable generators can take a ... production tax credit (PTC) on electricity sold. This means that some generators, primarily those operating wind turbines, may be willing to sell their output at negative prices to continue producing power." / "many are more willing to do so when they only have to pay for 5 minutes or an hour." |
| 32 | "In California's day-ahead market, prices were negative about 7 percent of the time in 2025, according to the grid operator's own market monitor." | 7.1% → "about 7 percent", 2025 (8.8% in 2024 for graphic) | https://www.caiso.com/documents/2025-annual-report-on-market-issues-and-performance.pdf | CAISO DMM 2025 Annual Report, Ch. 2 "Negative prices" (p. ~140): "For balancing areas participating in the day-ahead and real-time market—currently just the CAISO balancing area—... In the day-ahead market, the frequency decreased from 8.8 percent to 7.1 percent compared to the previous year." |
| 33 | "And Berkeley Lab found that in 2023, California's negative prices showed up almost entirely in sunny hours of late spring and early summer." | 2023 | LBNL PDF (row 27) | p. 4: "The dampening of daytime prices due to solar generation is particularly evident in CAISO, with relatively low prices seen during sunny hours ... Negative prices (the lightest blue color) were found almost exclusively during sunny hours in late spring and early summer." |
| 34 | "These are often gas turbines that run only occasionally. They cost more to run, but they respond quickly, which is exactly what that evening ramp needs." | none | https://www.eia.gov/todayinenergy/detail.php?id=13191 | EIA Oct 1, 2013: "Peaking units tend to run infrequently for short periods to help electric systems meet peak demand." / "Natural gas combustion turbines are more expensive to operate than other types of power plants but can respond quickly when needed, so they tend to be used when they are needed to meet short-term increases in electricity demand related to ramping or when loads (and therefore prices) are higher." |
| 35 | "That job belongs to balancing authorities, dozens of them across the country, keeping supply and demand matched in real time." | "dozens" | https://www.eia.gov/todayinenergy/detail.php?id=27152 | EIA July 20, 2016: Eastern Interconnection "36 balancing authorities: 31 in the United States"; Western "37 balancing authorities: 34 in the United States"; ERCOT "a single balancing authority". Trivial sum: 31 + 34 + 1 = 66 U.S. BAs (2016) → "dozens". "A balancing authority ensures, in real time, that power system demand and supply are finely balanced." |
| 36 | "If supply and demand drift too far apart, the EIA warns, the result can be local or even wide-area blackouts." | none | https://www.eia.gov/todayinenergy/detail.php?id=27152 | "If demand and supply fall out of balance, local or even wide-area blackouts can result." |
| 37 | "In the big regional markets, prices help with that job. The EIA notes they tend to fall when solar output is high and rise as it fades." | none | https://www.eia.gov/todayinenergy/detail.php?id=68384 ; https://www.eia.gov/todayinenergy/detail.php?id=13191 | id=68384 (Oct 30, 2026): "Wholesale prices in regions with large solar participation tend to fall when solar contributions are high and rise as they decrease." id=13191: "Natural gas combustion turbines are usually dispatched in response to price signals." |
| 38 | "The EIA's free Hourly Electric Grid Monitor shows demand and the mix of sources by region, hour by hour." | none | https://www.eia.gov/todayinenergy/detail.php?id=54899 ; https://www.eia.gov/electricity/gridmonitor/ | EIA Dec 6, 2022: "Our Hourly Electric Grid Monitor provides up-to-the-hour information on electricity demand across the U.S. electric grid." / "Hourly electricity generation and total interchange data are available with a one-day lag. ... generation by energy source and subregional demand data, which dates back to July 1, 2018." |
| 39 | "Most electric vehicle drivers charge overnight at home, according to the Department of Energy. And some utilities offer time-of-use rates, where electricity costs less in certain hours and more in others." | none | https://afdc.energy.gov/fuels/electricity-charging-home | DOE Alternative Fuels Data Center, "Charging Electric Vehicles at Home": "Most drivers of electric vehicles (EVs)... charge their vehicles overnight at home using AC Level 1 or AC Level 2 charging equipment." / "Some utilities offer residential time-of-use rates or other rate incentives for charging infrastructure owners." |
| 40 | "That's possible because most homes now have smart meters that record use at least hourly. In 2022, about 73 percent of U.S. residential electricity meters were smart meters, the EIA reports." | 73%, 2022 | https://www.eia.gov/tools/faqs/faq.php?id=108&t=3 | EIA FAQ: "In 2022, U.S. electric utilities had about 119 million advanced (smart) metering infrastructure (AMI) installations, equal to about 72% of total electric meters installations. Residential customers accounted for about 88% of total AMI installations, and about 73% of total residential electric meters were AMI meters." / "AMI includes meters that measure and record electricity usage at a minimum of hourly intervals" |
| 41 | "On California's wholesale market, some of the cheapest hours are now in the middle of the day, not the middle of the night." | none | LBNL PDF (row 27); CAISO DMM (row 32) | LBNL p. 4: "relatively low prices seen during sunny hours ... Negative prices ... were found almost exclusively during sunny hours in late spring and early summer." CAISO DMM: "Negative prices tend to be most common when renewable production is high and demand is low." (Wholesale only; script tells viewers to check their own retail rate plan.) |
Narration is AI-generated; script researched and reviewed by a human.
Education only, not financial advice.
The creator has no financial interest in any U.S. utility or data-center company.
Spotted an error? Tell us – fixes are logged on the corrections page.